

Wide diversity in structure and expression profiles among members of the Caenorhabditis elegans globin protein family
- PMID: 17916248
- PMCID: PMC2228317
- DOI: 10.1186/1471-2164-8-356
Wide diversity in structure and expression profiles among members of the Caenorhabditis elegans globin protein family
Abstract
Background: The emergence of high throughput genome sequencing facilities and powerful high performance bioinformatic tools has highlighted hitherto unexpected wide occurrence of globins in the three kingdoms of life. In silico analysis of the genome of C. elegans identified 33 putative globin genes. It remains a mystery why this tiny animal might need so many globins. As an inroad to understanding this complexity we initiated a structural and functional analysis of the globin family in C. elegans.
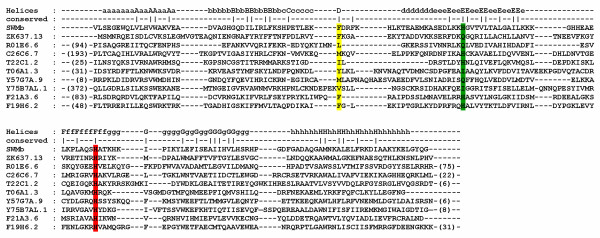
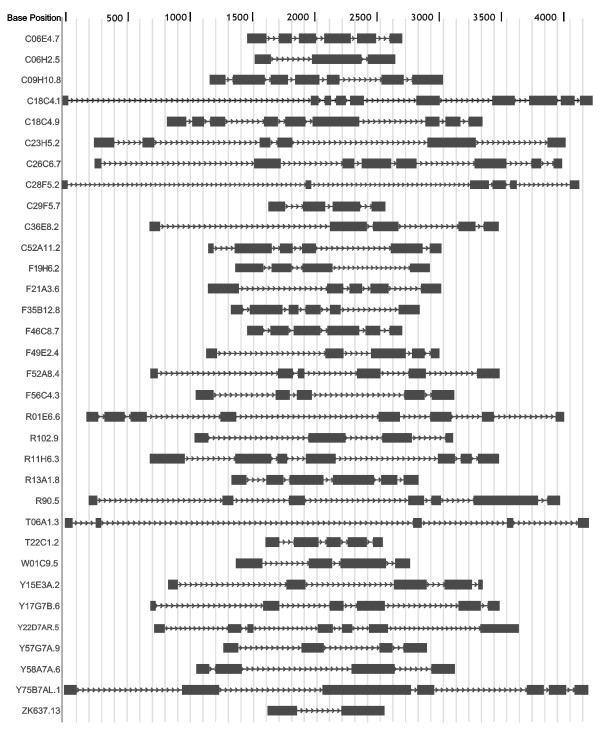
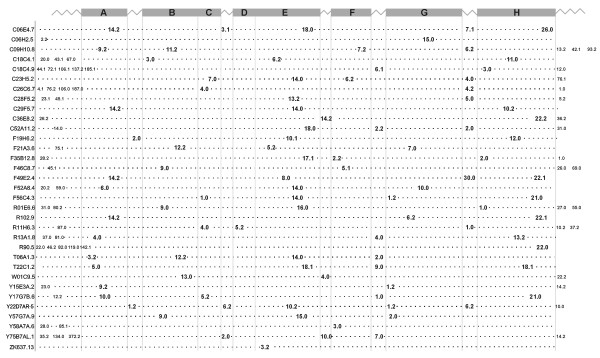
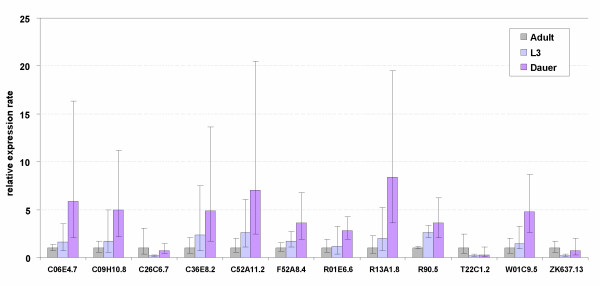
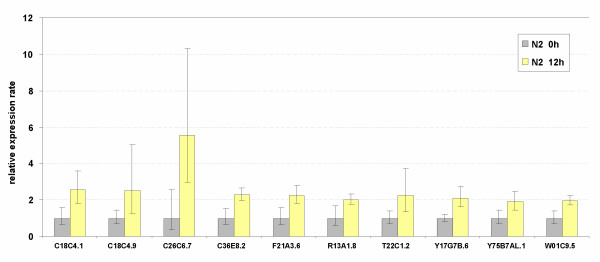
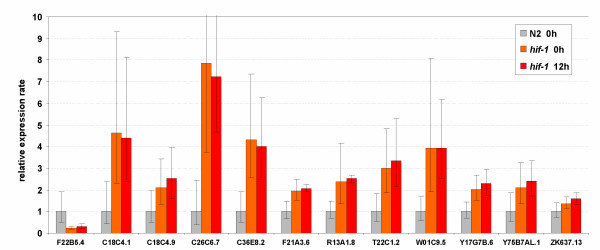
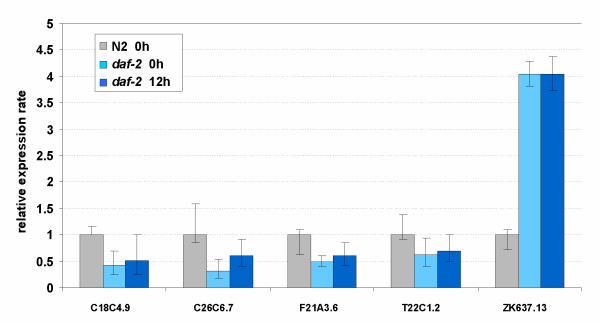
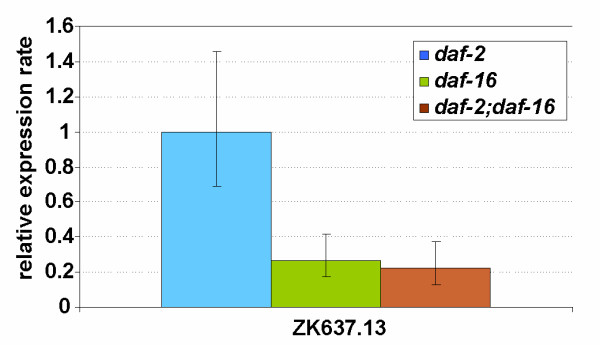
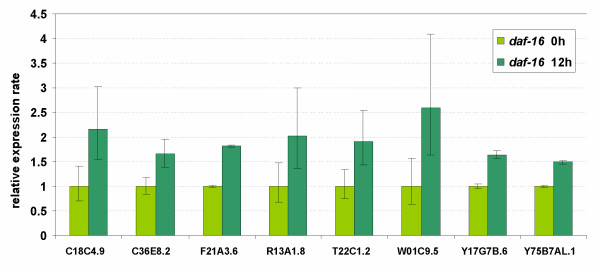
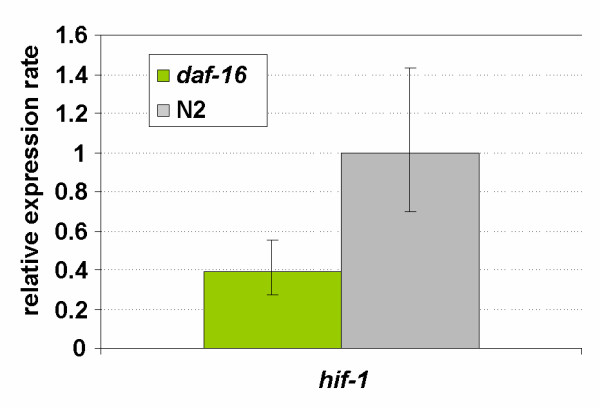
Results: All 33 C. elegans putative globin genes are transcribed. The translated sequences have the essential signatures of single domain bona fide globins, or they contain a distinct globin domain that is part of a larger protein. All globin domains can be aligned so as to fit the globin fold, but internal interhelical and N- and C-terminal extensions and a variety of amino acid substitutions generate much structural diversity among the globins of C. elegans. Likewise, the encoding genes lack a conserved pattern of intron insertion positioning. We analyze the expression profiles of the globins during the progression of the life cycle, and we find that distinct subsets of globins are induced, or repressed, in wild-type dauers and in daf-2(e1370)/insulin-receptor mutant adults, although these animals share several physiological features including resistance to elevated temperature, oxidative stress and hypoxic death. Several globin genes are upregulated following oxygen deprivation and we find that HIF-1 and DAF-2 each are required for this response. Our data indicate that the DAF-2 regulated transcription factor DAF-16/FOXO positively modulates hif-1 transcription under anoxia but opposes expression of the HIF-1 responsive globin genes itself. In contrast, the canonical globin of C. elegans, ZK637.13, is not responsive to anoxia. Reduced DAF-2 signaling leads to enhanced transcription of this globin and DAF-16 is required for this effect.
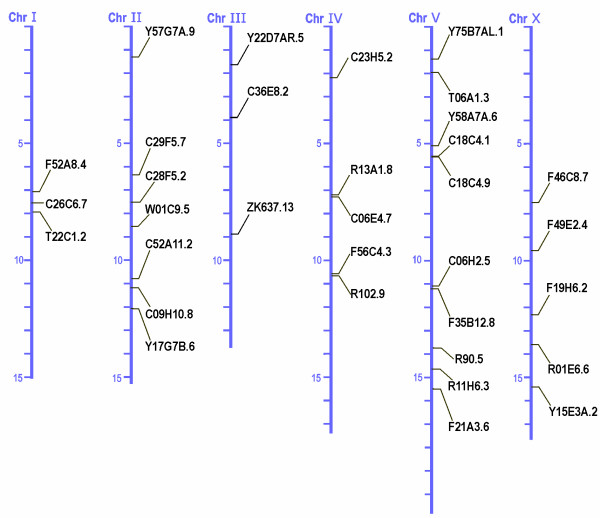
Conclusion: We found that all 33 putative globins are expressed, albeit at low or very low levels, perhaps indicating cell-specific expression. They show wide diversity in gene structure and amino acid sequence, suggesting a long evolutionary history. Ten globins are responsive to oxygen deprivation in an interacting HIF-1 and DAF-16 dependent manner. Globin ZK637.13 is not responsive to oxygen deprivation and regulated by the Ins/IGF pathway only suggesting that this globin may contribute to the life maintenance program.
Figures
Similar articles
-
A globin domain in a neuronal transmembrane receptor of Caenorhabditis elegans and Ascaris suum: molecular modeling and functional properties.J Biol Chem. 2015 Apr 17;290(16):10336-52. doi: 10.1074/jbc.M114.576520. Epub 2015 Feb 9. J Biol Chem. 2015. PMID: 25666609 Free PMC article.
-
The DAF-16 FOXO transcription factor regulates natc-1 to modulate stress resistance in Caenorhabditis elegans, linking insulin/IGF-1 signaling to protein N-terminal acetylation.PLoS Genet. 2014 Oct 16;10(10):e1004703. doi: 10.1371/journal.pgen.1004703. eCollection 2014 Oct. PLoS Genet. 2014. PMID: 25330323 Free PMC article.
-
DAF-16-dependent and independent expression targets of DAF-2 insulin receptor-like pathway in Caenorhabditis elegans include FKBPs.J Mol Biol. 2001 Dec 14;314(5):1017-28. doi: 10.1006/jmbi.2000.5210. J Mol Biol. 2001. PMID: 11743719
-
Worming pathways to and from DAF-16/FOXO.Exp Gerontol. 2006 Oct;41(10):928-34. doi: 10.1016/j.exger.2006.05.020. Epub 2006 Jul 12. Exp Gerontol. 2006. PMID: 16839734 Review.
-
The search for DAF-16/FOXO transcriptional targets: approaches and discoveries.Exp Gerontol. 2006 Oct;41(10):910-21. doi: 10.1016/j.exger.2006.06.040. Epub 2006 Aug 24. Exp Gerontol. 2006. PMID: 16934425 Review.
Cited by
-
A proteomic view of Caenorhabditis elegans caused by short-term hypoxic stress.Proteome Sci. 2010 Sep 21;8:49. doi: 10.1186/1477-5956-8-49. Proteome Sci. 2010. PMID: 20858264 Free PMC article.
-
Applications of cold temperature stress to age fractionate Caenorhabditis elegans: a simple inexpensive technique.J Gerontol A Biol Sci Med Sci. 2010 May;65(5):457-67. doi: 10.1093/gerona/glq036. Epub 2010 Mar 30. J Gerontol A Biol Sci Med Sci. 2010. PMID: 20354064 Free PMC article.
-
Globin-like proteins in Caenorhabditis elegans: in vivo localization, ligand binding and structural properties.BMC Biochem. 2010 Apr 2;11:17. doi: 10.1186/1471-2091-11-17. BMC Biochem. 2010. PMID: 20361867 Free PMC article.
-
The archipelago ubiquitin ligase subunit acts in target tissue to restrict tracheal terminal cell branching and hypoxic-induced gene expression.PLoS Genet. 2013;9(2):e1003314. doi: 10.1371/journal.pgen.1003314. Epub 2013 Feb 14. PLoS Genet. 2013. PMID: 23459416 Free PMC article.
-
A globin domain in a neuronal transmembrane receptor of Caenorhabditis elegans and Ascaris suum: molecular modeling and functional properties.J Biol Chem. 2015 Apr 17;290(16):10336-52. doi: 10.1074/jbc.M114.576520. Epub 2015 Feb 9. J Biol Chem. 2015. PMID: 25666609 Free PMC article.
References
-
- Vinogradov SN, Hoogewijs D, Bailly X, Arredondo-Peter R, Guertin M, Gough J, Dewilde S, Moens L, Vanfleteren JR. Three globin lineages belonging to two structural classes in genomes from the three kingdoms of life. Proc Natl Acad Sci U S A. 2005;102:11385–11389. doi: 10.1073/pnas.0502103102. - DOI - PMC - PubMed
-
- Weber RE, Vinogradov SN. Nonvertebrate hemoglobins: functions and molecular adaptations. Physiol Rev. 2001;81:569–628. - PubMed
-
- Green BN, Gotoh T, Suzuki T, Zal F, Lallier FH, Toulmond A, Vinogradov SN. Observation of large, non-covalent globin subassemblies in the approximately 3600 kDa hexagonal bilayer hemoglobins by electrospray ionization time-of-flight mass spectrometry. J Mol Biol. 2001;309:553–560. doi: 10.1006/jmbi.2001.4704. - DOI - PubMed
Publication types
MeSH terms
Substances
LinkOut - more resources
Full Text Sources
Research Materials
Miscellaneous
