. 2007 Nov;133(5):1592-602.
doi: 10.1053/j.gastro.2007.08.020. Epub 2007 Aug 14.

Cyclic AMP regulates bicarbonate secretion in cholangiocytes through release of ATP into bile

Affiliations

Cyclic AMP regulates bicarbonate secretion in cholangiocytes through release of ATP into bile

Noritaka Minagawa et al. Gastroenterology. 2007 Nov.

Abstract

Background & aims: Bicarbonate secretion is a primary function of cholangiocytes. Either adenosine 3',5'-cyclic monophosphate (cAMP) or cytosolic Ca(2+) can mediate bicarbonate secretion, but these are thought to act through separate pathways. We examined the role of the inositol 1,4,5-trisphosphate receptor (InsP3R) in mediating bicarbonate secretion because this is the only intracellular Ca(2+) release channel in cholangiocytes.

Methods: Intrahepatic bile duct units (IBDUs) were microdissected from rat liver then luminal pH was examined by confocal microscopy during IBDU microperfusion. Cyclic AMP was increased using forskolin or secretin, and Ca(2+) was increased using acetylcholine (ACh) or adenosine triphosphate (ATP). Apyrase was used to hydrolyze extracellular ATP, and suramin was used to block apical P2Y ATP receptors. In selected experiments, IBDUs were pretreated with short interfering RNA (siRNA) to silence expression of specific InsP3R isoforms.

Results: Both cAMP and Ca(2+) agonists increased luminal pH. The effect of ACh on luminal pH was reduced by siRNA for basolateral (types I and II) but not apical (type III) InsP3R isoforms. The effect of forskolin on luminal pH was reduced by a cystic fibrosis transmembrane conductance regulator (CFTR) inhibitor and by siRNA for the type III InsP3R. Luminal apyrase or suramin blocked the effects of forskolin but not ACh on luminal pH.

Conclusions: Cyclic AMP-induced ductular bicarbonate secretion depends on an autocrine signaling pathway that involves CFTR, apical release of ATP, stimulation of apical nucleotide receptors, and then activation of apical, type III InsP3Rs. The primary role of CFTR in bile duct secretion may be to regulate secretion of ATP rather than to secrete chloride and/or bicarbonate.


Figures

Figure 1
Figure 1
Measurement of pH in microdissected, microperfused bile ducts stimulated with forskolin (100 μM). (a) Confocal image of a microperfused bile ductule. (b) Forskolin-induced bicarbonate secretion is similar in freshly isolated bile ducts and ducts in culture for 24 hr, while the CFTR inhibitor CFTRinh-172 blocks forskolin-induced increases in ductular pH. Values here and in subsequent tracings are mean±SEM (n=3 experiments under each condition).
Figure 1
Figure 1
Measurement of pH in microdissected, microperfused bile ducts stimulated with forskolin (100 μM). (a) Confocal image of a microperfused bile ductule. (b) Forskolin-induced bicarbonate secretion is similar in freshly isolated bile ducts and ducts in culture for 24 hr, while the CFTR inhibitor CFTRinh-172 blocks forskolin-induced increases in ductular pH. Values here and in subsequent tracings are mean±SEM (n=3 experiments under each condition).
Figure 2
Figure 2
Effects of ACh and ATP on ductular pH. Each agent was added to the bathing medium for basolateral stimulation. (a) ACh (100 μM)-induced increase in ductular pH (n=3 ductules). The CFTR inhibitor CFTRinh-172 does not block the effects of ACh. (b) ATP (100 μM)-induced increase in ductular pH (n=3 ductules).
Figure 2
Figure 2
Effects of ACh and ATP on ductular pH. Each agent was added to the bathing medium for basolateral stimulation. (a) ACh (100 μM)-induced increase in ductular pH (n=3 ductules). The CFTR inhibitor CFTRinh-172 does not block the effects of ACh. (b) ATP (100 μM)-induced increase in ductular pH (n=3 ductules).
Figure 3
Figure 3
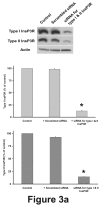
Validation of siRNA for each isoform of the InsP3R. (a) co-treatment of CHO cells with siRNA for type I and II InsP3R reduces expression of both isoforms. Densitometric values are mean±SEM of 2 replicates (p<0.01). (b) Treatment of CHO cells with siRNA for type III InsP3R reduces expression of that isoform. Densitometric values are mean±SEM of 3 replicates (p<0.01). The isoform specificity of each siRNA construct has been demonstrated previously (13).
Figure 3
Figure 3
Validation of siRNA for each isoform of the InsP3R. (a) co-treatment of CHO cells with siRNA for type I and II InsP3R reduces expression of both isoforms. Densitometric values are mean±SEM of 2 replicates (p<0.01). (b) Treatment of CHO cells with siRNA for type III InsP3R reduces expression of that isoform. Densitometric values are mean±SEM of 3 replicates (p<0.01). The isoform specificity of each siRNA construct has been demonstrated previously (13).
Figure 4
Figure 4
Use of siRNA to decrease expression of specific InsP3R isoforms in microdissected bile ducts. (a) Type I InsP3R (InsP3R-1) is distributed throughout cholangiocytes (left) and expression is undetectable after treatment with isoform-specific siRNA (right). Ducts are triple-labeled for type I (red) and type III (green) InsP3R and nuclei (blue). (b) Type II InsP3R (InsP3R-2) is distributed throughout cholangiocytes (left) and expression is undetectable after treatment with isoform-specific siRNA (right). Ducts are triple-labeled for type II (red) and type III (green) InsP3R and nuclei (blue). (c) Type III InsP3R (InsP3R-3) is concentrated in the apical region of cholangiocytes (left) and expression is undetectable after treatment with isoform-specific siRNA (right). Ducts are double-labeled for type III InsP3R (green) and nuclei (blue). Cross-sections of each duct are based on three-dimensional reconstructions of confocal images collected from serial focal planes.
Figure 4
Figure 4
Use of siRNA to decrease expression of specific InsP3R isoforms in microdissected bile ducts. (a) Type I InsP3R (InsP3R-1) is distributed throughout cholangiocytes (left) and expression is undetectable after treatment with isoform-specific siRNA (right). Ducts are triple-labeled for type I (red) and type III (green) InsP3R and nuclei (blue). (b) Type II InsP3R (InsP3R-2) is distributed throughout cholangiocytes (left) and expression is undetectable after treatment with isoform-specific siRNA (right). Ducts are triple-labeled for type II (red) and type III (green) InsP3R and nuclei (blue). (c) Type III InsP3R (InsP3R-3) is concentrated in the apical region of cholangiocytes (left) and expression is undetectable after treatment with isoform-specific siRNA (right). Ducts are double-labeled for type III InsP3R (green) and nuclei (blue). Cross-sections of each duct are based on three-dimensional reconstructions of confocal images collected from serial focal planes.
Figure 5
Figure 5
Loss of the types I and II InsP3R selectively impairs ACh-induced bicarbonate secretion. (a) Tracings show that ACh (100 μM) increases ductular pH under control conditions and after treatment with siRNA for type III InsP3R, but the effect of ACh is blocked after treatment with siRNA for types I and II InsP3R. Values are mean±SEM of n=3 experiments under each condition. (b) Bar graph summary of the peak increase in luminal pH under each experimental condition (*p<0.05). (c) Bar graph summary of the area under the curve (AUC) for luminal pH during 25 min of stimulation with ACh under each experimental condition (*p<0.05).
Figure 5
Figure 5
Loss of the types I and II InsP3R selectively impairs ACh-induced bicarbonate secretion. (a) Tracings show that ACh (100 μM) increases ductular pH under control conditions and after treatment with siRNA for type III InsP3R, but the effect of ACh is blocked after treatment with siRNA for types I and II InsP3R. Values are mean±SEM of n=3 experiments under each condition. (b) Bar graph summary of the peak increase in luminal pH under each experimental condition (*p<0.05). (c) Bar graph summary of the area under the curve (AUC) for luminal pH during 25 min of stimulation with ACh under each experimental condition (*p<0.05).
Figure 6
Figure 6
Loss of the type III InsP3R selectively impairs forskolin-induced bicarbonate secretion. (a) Tracings show that forskolin (100 μM) increases ductular pH in bile ducts in culture for 24 hr that have been treated with scrambled siRNA (control group) and after treatment with siRNA for types I and II InsP3R, but the effect of forskolin is significantly reduced after treatment with siRNA for type III InsP3R. Values are mean±SEM of n=3 experiments under each condition. (b) Bar graph summary of the peak increase in luminal pH under each experimental condition (*p<0.05). (c) Bar graph summary of the AUC for luminal pH under each experimental condition (*p<0.05).
Figure 6
Figure 6
Loss of the type III InsP3R selectively impairs forskolin-induced bicarbonate secretion. (a) Tracings show that forskolin (100 μM) increases ductular pH in bile ducts in culture for 24 hr that have been treated with scrambled siRNA (control group) and after treatment with siRNA for types I and II InsP3R, but the effect of forskolin is significantly reduced after treatment with siRNA for type III InsP3R. Values are mean±SEM of n=3 experiments under each condition. (b) Bar graph summary of the peak increase in luminal pH under each experimental condition (*p<0.05). (c) Bar graph summary of the AUC for luminal pH under each experimental condition (*p<0.05).
Figure 7
Figure 7
Forskolin increases cytosolic Ca2+ in cholangiocytes. (a) ACh (100 μM) induces a rapid, transient increase in Ca2+, as has been described previously (9). (b) Forskolin (100 μM) induces a gradual, progressive increase in Ca2+, which is blocked by suramin (50 μM). Tracings depict Ca2+ signals measured by confocal microscopy in individual cholangiocytes within isolated intrahepatic bile duct segments. (c) Bar graph summary of results. Each result is mean±SEM of the peak response elicited in >20 cells from at least three separate bile duct preparations under each experimental condition.
Figure 8
Figure 8
Forskolin- but not ACh-induced bicarbonate secretion is mediated by luminal ATP. (a) pH tracings, (b) bar graph summary of the peak increase in luminal pH, and (c) bar graph summary of the AUC for luminal pH after treatment with forskolin under control conditions and after luminal administration of the ATP hydrolyzing agent apyrase (3 U/mL), the P2Y receptor antagonist suramin (50 μM), or the cytosolic Ca2+ chelator BAPTA/AM (30 μM). (d) pH tracings, (e) bar graph summary of the peak increase in luminal pH, and (f) bar graph summary of the AUC for luminal pH after treatment with ACh under control conditions and after luminal administration of either apyrase or suramin. Values are mean±SEM of 3 separate measurements (*p<0.05).
Figure 8
Figure 8
Forskolin- but not ACh-induced bicarbonate secretion is mediated by luminal ATP. (a) pH tracings, (b) bar graph summary of the peak increase in luminal pH, and (c) bar graph summary of the AUC for luminal pH after treatment with forskolin under control conditions and after luminal administration of the ATP hydrolyzing agent apyrase (3 U/mL), the P2Y receptor antagonist suramin (50 μM), or the cytosolic Ca2+ chelator BAPTA/AM (30 μM). (d) pH tracings, (e) bar graph summary of the peak increase in luminal pH, and (f) bar graph summary of the AUC for luminal pH after treatment with ACh under control conditions and after luminal administration of either apyrase or suramin. Values are mean±SEM of 3 separate measurements (*p<0.05).
Figure 9
Figure 9
Signaling pathways for bicarbonate secretion in cholangiocytes. Stimulation of basolateral M3 muscarinic receptors with ACh locally increases InsP3, which releases Ca2+ from basolateral (type I and II) InsP3Rs, leading to apical bicarbonate secretion. Stimulation of basolateral secretin receptors increases cAMP, which induces apical, CFTR-dependent release of ATP. This stimulates apical P2Y nucleotide receptors, which locally increases InsP3 and releases Ca2+ from apical (type III) InsP3Rs, also leading to apical bicarbonate secretion.

Comment in

References

    1. Nathanson MH, Burgstahler AD, Mennone A, Dranoff JA, Rios-Velez L. Stimulation of bile duct epithelial secretion by glybenclamide in normal and cholestatic rat liver. J Clin Invest. 1998;101:2665–2676. - PMC - PubMed
    1. Hirata K, Nathanson MH. Bile duct epithelia regulate biliary bicarbonate excretion in normal rat liver. Gastroenterology. 2001;121:396–406. - PubMed
    1. Boyer JL, Nathanson MH. Bile formation. In: Schiff ER, Sorrell MF, Maddrey WC, editors. Diseases of the liver. 1999. pp. 119–146.
    1. Lazaridis KN, Strazzabosco M, Larusso NF. The cholangiopathies: disorders of biliary epithelia. Gastroenterology. 2004;127:1565–1577. - PubMed
    1. Kanno N, LeSage G, Glaser S, Alpini G. Regulation of cholangiocyte bicarbonate secretion. Am J Physiol Gastrointest Liver Physiol. 2001;281:G612–G625. - PubMed

Publication types

MeSH terms