. 2007 Dec;36(4):501-14.
doi: 10.1016/j.mcn.2007.08.013. Epub 2007 Aug 24.

Regulation of low affinity neurotrophin receptor (p75(NTR)) by early growth response (Egr) transcriptional regulators

Affiliations

Regulation of low affinity neurotrophin receptor (p75(NTR)) by early growth response (Egr) transcriptional regulators

Xiaoguang Gao et al. Mol Cell Neurosci. 2007 Dec.

Abstract

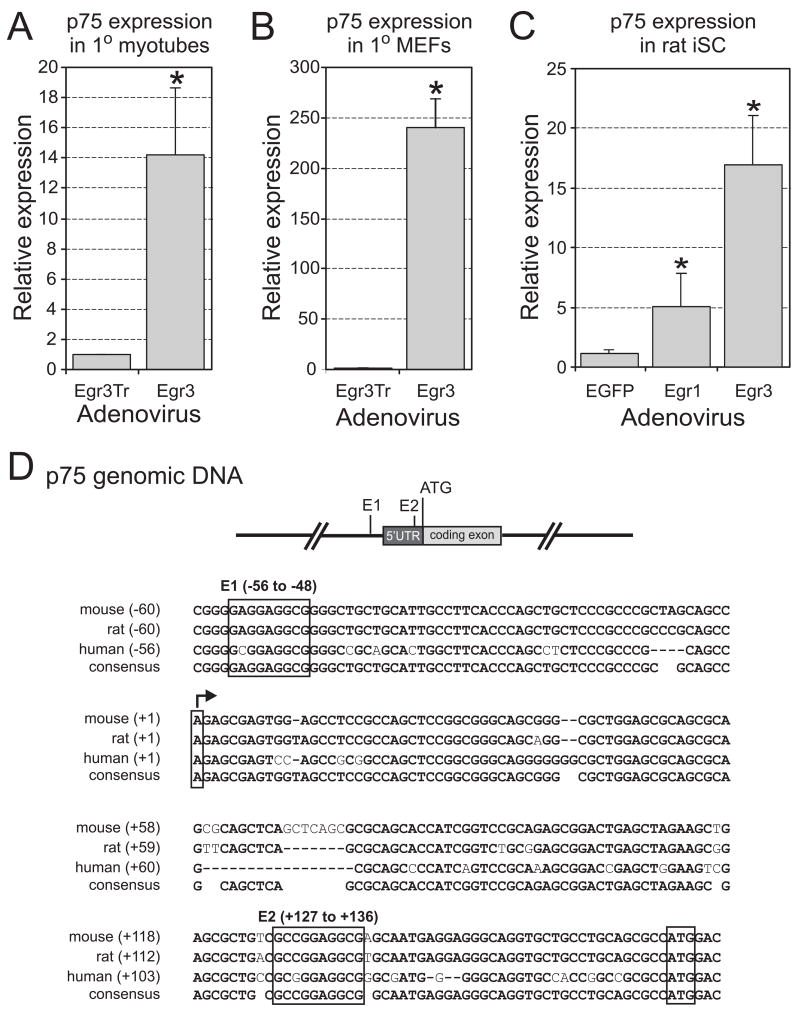
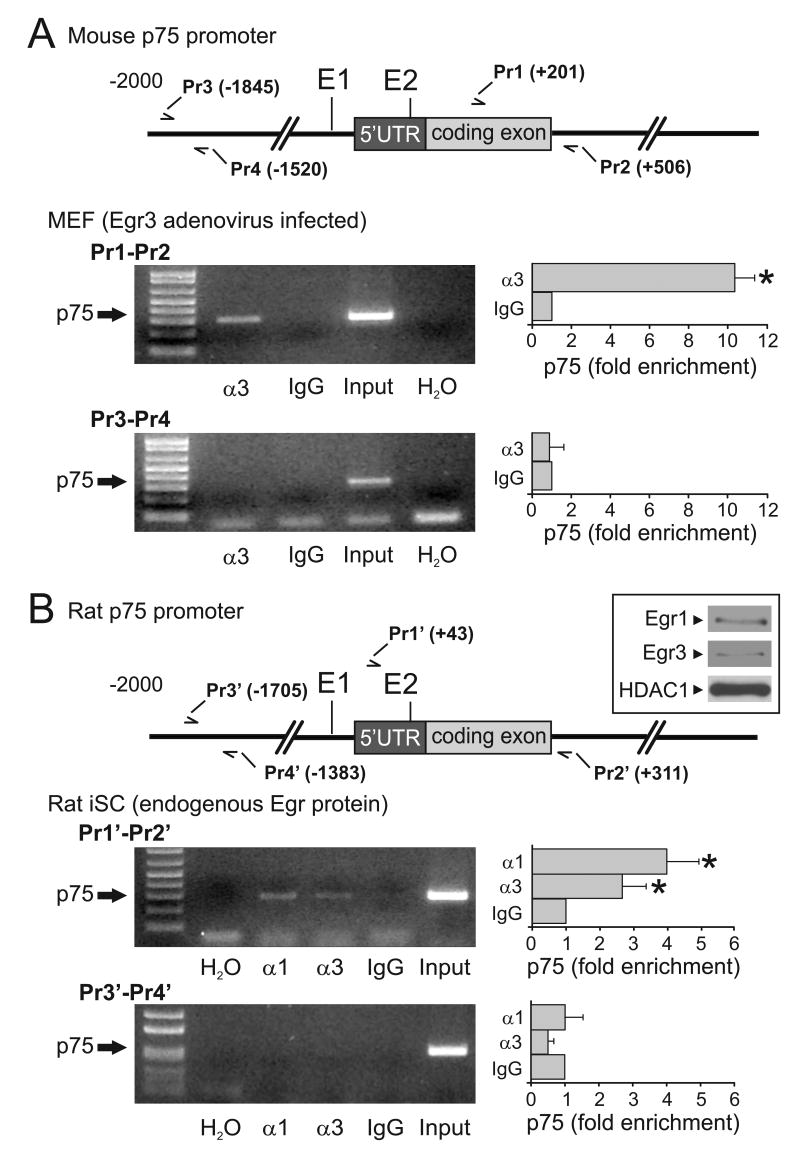
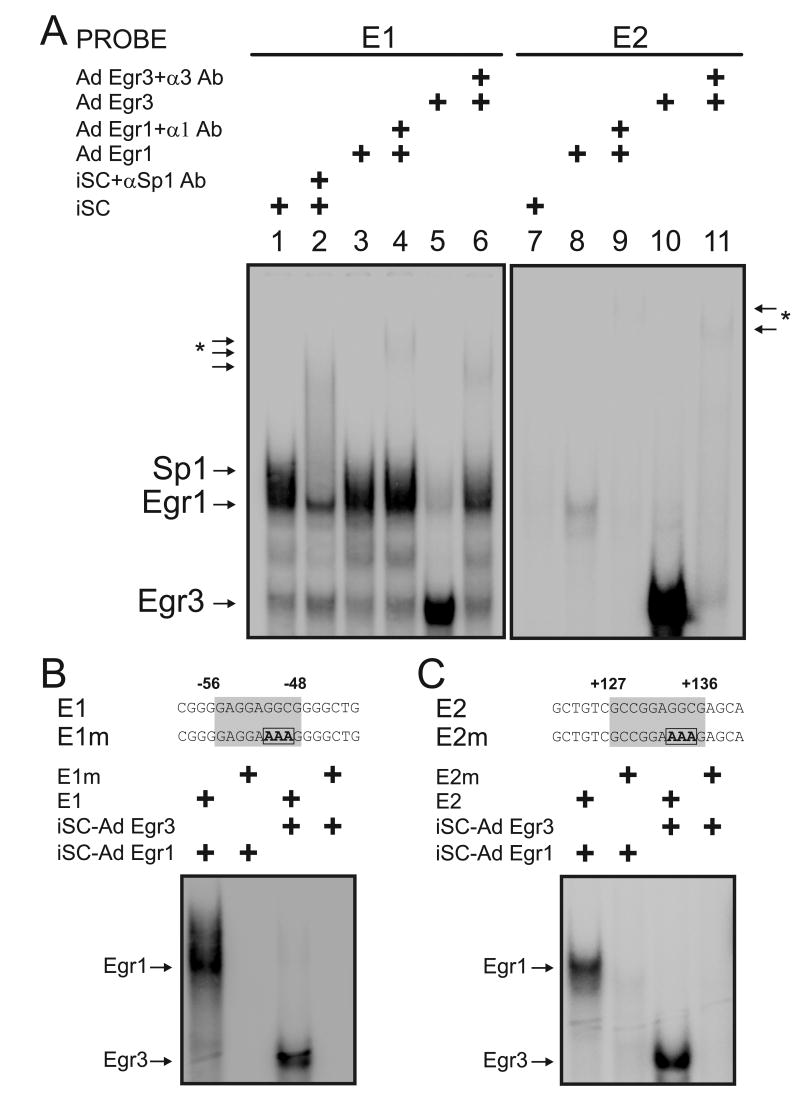
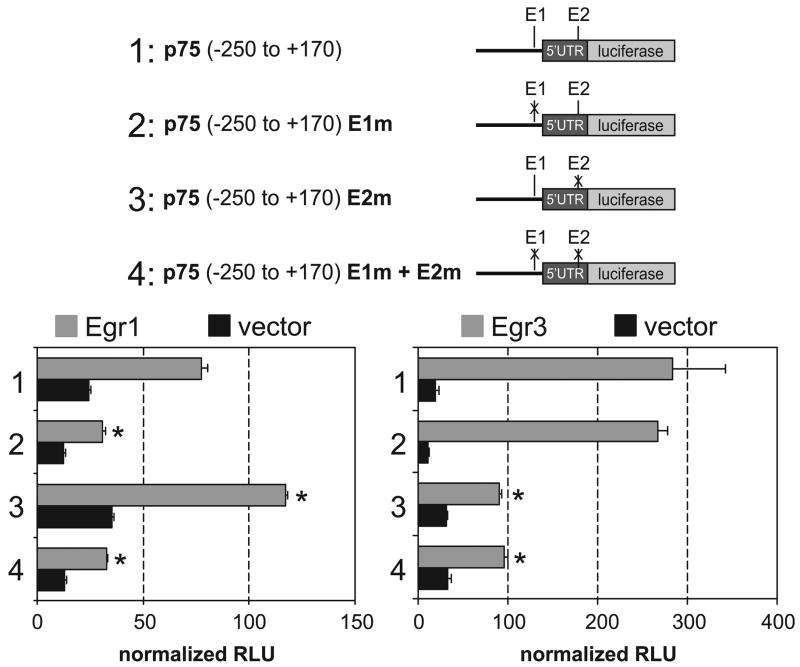
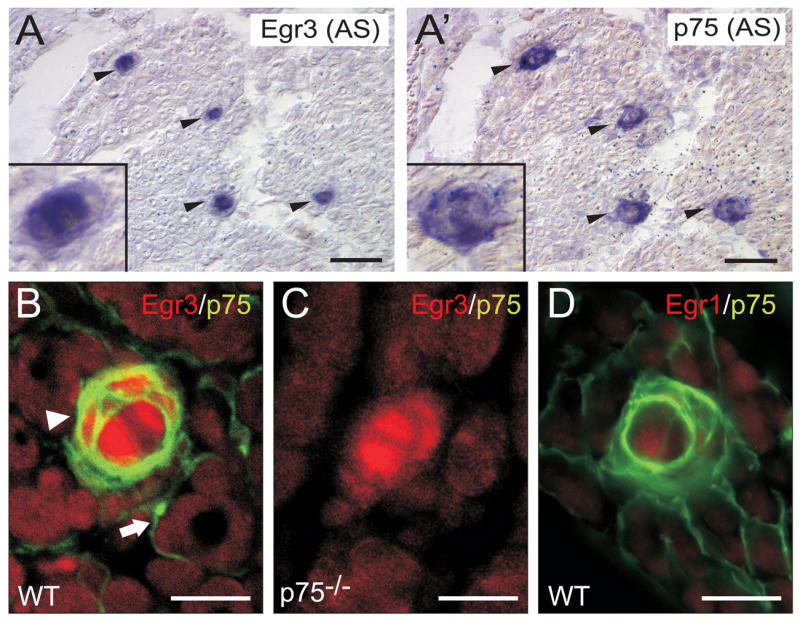
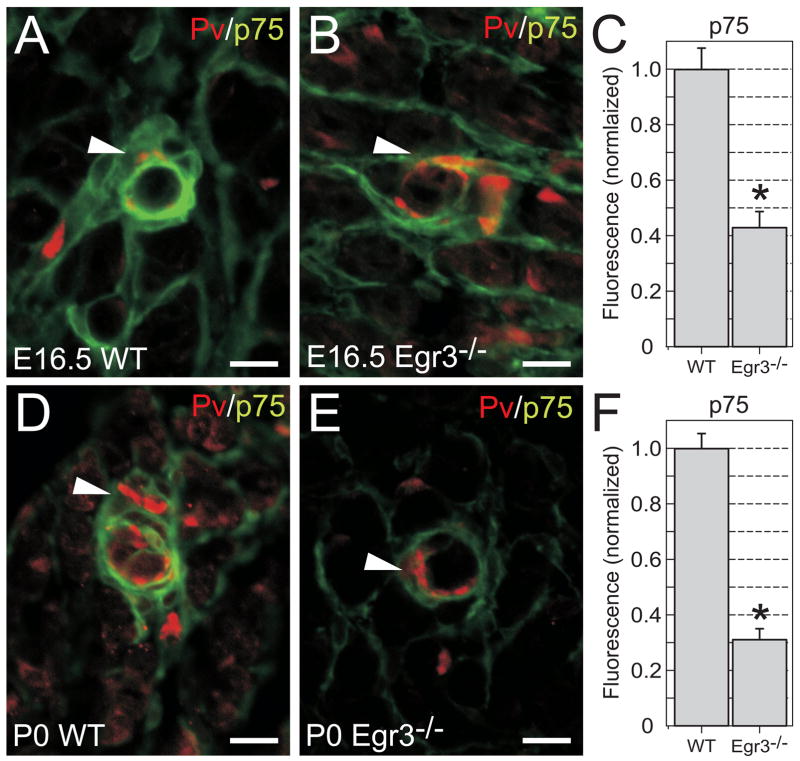
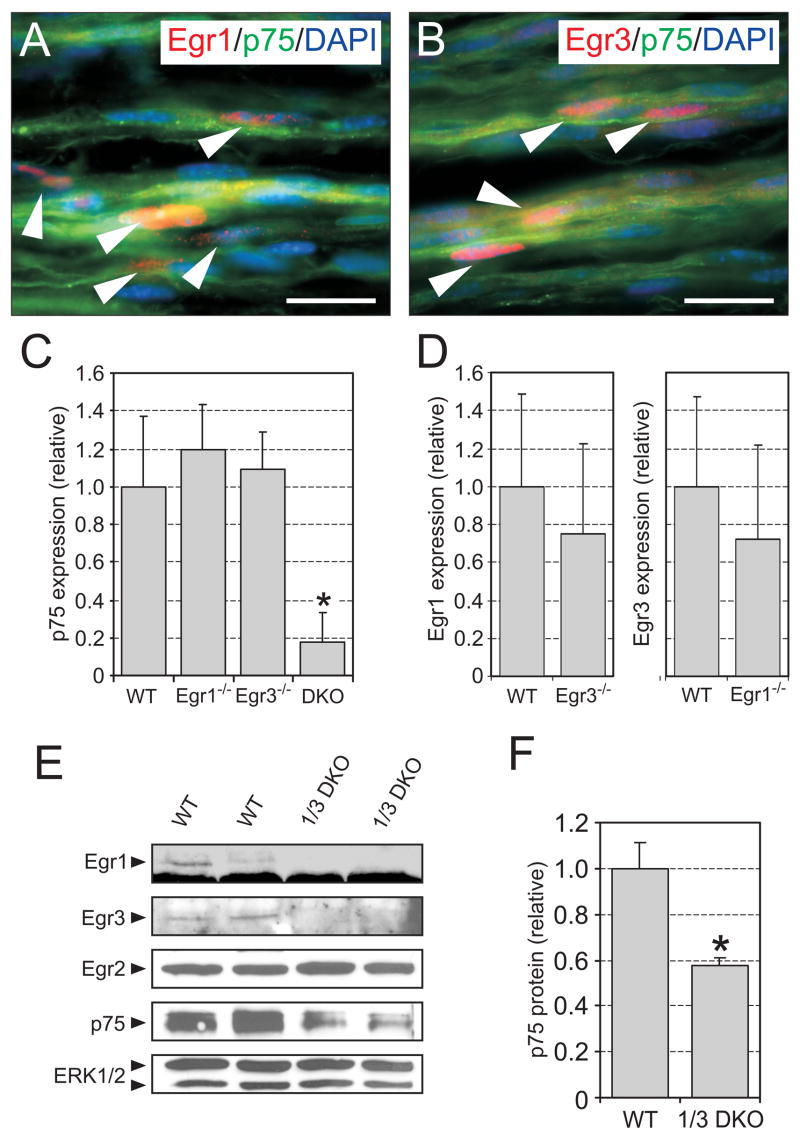
The low affinity neurotrophin receptor p75(NTR) is a multifunctional receptor with important roles in neurotrophin signaling, axon outgrowth, and oligodendroglia and neuron survival. It is transcriptionally regulated with spatial and temporal precision during nervous system development, injury and regeneration. Very little is known about how p75(NTR) expression is dynamically regulated but it is likely to influence how p75(NTR) signals in particular cellular contexts. Here, we identify the early growth response (Egr) transcriptional regulators, Egr1 and Egr3, as direct modulators of p75(NTR) gene expression. Egr1 and Egr3 bind and transactivate the p75(NTR) promoter in vitro and in vivo, using distinct response elements on the p75(NTR) promoter. Consistent with these results, p75(NTR) expression is greatly diminished in muscle spindle stretch receptors and in peripheral nerve Schwann cells in Egr gene deficient mice. Taken together, the results elucidate a novel mechanism whereby Egr proteins can directly modulate p75(NTR) expression and signaling in vivo.


Figures

Figure 1
Figure 1
Egr1 and Egr3 induce p75NTR expression through species conserved Egr response elements (EREs) in its promoter. p75NTR expression is significantly upregulated by Egr3 (A) 14.2-fold in primary mouse myotubes, (B) 240-fold in mouse embryonic fibroblasts (MEFs) and (C) 5.1-fold by Egr1 and 17-fold by Egr3 in immortalized rat Schwann cells (iSCs). p75NTR expression in cells infected with either Egr1 or Egr3 expressing adenovirus is normalized to expression in cells infected with either Egr3Tr or EGFP expressing adenovirus as indicated. (results represent mean ± standard deviation of three independent experiments, * = p < 0.05, Students t test). (D) Alignment of a portion of the p75NTR 5′ regulatory sequence in mouse, rat and human relative to the transcription start site (arrow) and translation start codon (ATG) shows two highly conserved potential EREs designated E1 upstream of the transcription start site (−56 to −48) and E2 within the 5′ untranslated region (5′UTR) of the first exon (+127 to +136).
Figure 2
Figure 2
Both Egr1 and Egr3 bind to the p75NTR promoter in vivo. (A) ChIP performed on nuclear lysates from primary mouse embryonic fibroblasts (MEFs) infected with Egr3 expressing adenovirus demonstrates that Egr3 directly binds to p75NTR in vivo. Immunoprecipitation using Egr3 specific anti-serum (α3), shows that Egr3 directly binds to a region proximal (Pr1–Pr2), but not distal (Pr3–Pr4) to the putative E1 and E2 response elements in p75NTR. (B) Immortalized rat Schwann cells (iSCs) express endogenous Egr1 and Egr3 (inset) in serum containing growth medium. The ubiquitous histone deacetylase 1 (HDAC1) nuclear protein is also shown as a reference. Immunoprecipitation using either Egr1 (α1) or Egr3 (α3) specific anti-serum, but not non-specific IgG, shows that both Egr1 and Egr3 bind proximal (Pr1′–Pr2′) but not distal (Pr3′–Pr4′) to the putative E1 and E2 response elements. For both MEFs and iSCs, the enrichment of chromatin precipitated by α3 or α1 relative to IgG is assessed by endpoint (35-cycle) PCR (left) and qPCR (right). (primer locations are indicated relative to mouse and rat p75NTR transcriptional start sites, respectively, and qPCR results represent mean ± standard deviation of three independent experiments, * = p < 0.05, Student’s t test)
Figure 3
Figure 3
Egr1 and Egr3 bind to the E1 and E2 response elements in the p75NTR promoter in vitro. (A) E1 and E2 represent high- and low-affinity Egr binding sites in the p75NTR promoter, respectively. Egr1, Egr3 and the transcriptional regulator Sp1 are present within nuclear lysates from iSCs grown in serum containing media and all of them bind to E1 (lane 1). Sp1 (lane2), Egr1 (lane 4), and Egr3 (lane 6) are identified within the shifted complexes bound to E1 by the formation of relatively unstable supershift complexes (arrows with asterisk) and concomitant disruption of the protein-DNA complex by antibodies that specifically bind to the respective proteins. The Egr1 containing complex is obscured by the intense Sp1 complex that runs with similar mobility (lanes 3 and 4). When E2 is used as a probe, the endogenous levels of Egr1 and Egr3 in iSCs grown in serum do not form detectable complexes with the probe (lane 7). However, when the levels of Egr1 protein are elevated by infection with Egr1 expressing adenovirus, a faint complex is formed (lane 8) which is shifted away by an Egr1 specific antibody (lane 9). Similarly, when iSCs are infected with Egr3 expressing adenovirus, a prominent complex with Egr3 is formed (lane 10) that is shifted away by the addition of Egr3 specific antibody (lane 11). (B) Egr1 protein present in nuclear lysates from Egr1-expressing adenovirus infected immortalized rat Schwann cells (iSC-Ad Egr1) or Egr3 protein present in Egr3-expressing adenovirus infected immortalized rat Schwann cells (iSC-Ad Egr3) bind to a double stranded E1 oligo but not an E1m oligo which has a mutation within the core Egr binding domain (gray). (C) Similarly, Egr1 and Egr3 bind to E2 but not E2m which also contains a mutation that disrupts Egr protein binding.
Figure 4
Figure 4
Egr1 and Egr3 transactivate p75NTR through distinct E1 and E2 response elements, respectively. Mutations that specifically disrupt Egr1 and Egr3 binding to E1 (Fig. 4B) and E2 (Fig. 4C) were introduced into construct 1. While either Egr1 or Egr3 markedly transactivate the minimal p75NTR promoter (construct 1), transactivation by Egr1, but not Egr3, is significantly reduced when E1 is mutated (construct 2). Interestingly, while transactivation by Egr1 is slightly superactivated when E2 is mutated, transactivation by Egr3 is significantly reduced (construct 3). When both E1 and E2 are mutated (construct 4), transactivation by either Egr1 or Egr3 is significantly impaired. (RLU = relative light units representing values normalized for transfection efficiency; results represent mean ± standard deviation of three independent transfection experiments; * = p < 0.05; Student’s t test compared to construct 1)
Figure 5
Figure 5
Egr3 expression is colocalized with p75NTR expression in muscle spindles. In situ hybridization on adjacent wild type (WT) newborn skeletal muscle sections demonstrates strong (A) Egr3 and (A) p75NTR expression specifically in muscle spindles (arrowheads). (B) Egr3 (red) and p75NTR (green) proteins are colocalized in intrafusal muscle fibers and spindle capsule cells of spindle stretch receptors (arrowhead), but only p75NTR protein is present in the muscle endomyseum (arrow). (C) The p75NTR antibody is highly specific, as there is complete loss of protein staining in spindles and the muscle endomyseum in p75NTR-deficient skeletal muscle. (D) Egr1 is not expressed by muscle spindles, consistent with the fact that Egr3, but not Egr1, is essential for regulating gene expression necessary for normal spindle stretch receptor morphogenesis. (scale bar = 20μm)
Figure 6
Figure 6
p75NTR expression is deregulated in Egr3-deficient muscle spindle stretch receptors. (A) In E16.5 wild type (WT) and (D) P0 (newborn) skeletal muscle, p75NTR protein (green) is present in spindle stretch receptors (arrowhead) and muscle endomyseum. In Egr3-deficient (B) E16.5 and (E) P0 skeletal muscle, p75NTR protein is significantly decreased in spindle stretch receptors but not in muscle endomyseum. (C, F) Comparative quantitative fluorescence analysis shows that p75NTR protein is reduced by 58% in E16.5 spindles and by 69% in P0 Egr3-deficient spindles relative to wild type. Parvalbumin (Pv) immunohistochemistry is used to localize the Ia-sensory axons that innervate the spindle stretch receptors (red). (results represent mean ± standard deviation of fluorescence intensity measurements from 15–20 spindles in two separate animals from each genotype and age; * = p < 0.05; Student’s t test compared to wild type; scale bar = 20μm).
Figure 7
Figure 7
Functional complementation by Egr1 and Egr3 to regulate p75NTR expression in sciatic nerves in vivo. (A, B) Egr1 and Egr3 are expressed in many p75NTR expressing-Schwann cells in mouse sciatic nerves (Egr1/Egr3 (red), p75NTR (green), DAPI nuclear stain (blue)). (C) qPCR analysis of p75NTR expression in P21 mouse sciatic nerve demonstrates that expression is reduced by 82.5% in 1/3 DKO compared to WT, Egr1−/− or Egr3−/− nerves. p75NTR expression is not altered in Egr1 or Egr3 single knockout sciatic nerves compared to WT. (D) Although Egr1 and Egr3 apparently complement each other to regulate p75NTR expression, this is not due to upregulation of either Egr1 or Egr3 expression. There is no evidence of either Egr1 upregulation in Egr3−/− nerves or Egr3 upregulation in Egr1−/− nerves. (qPCR results from C and D represent mean ± standard deviation of GAPDH normalized p75NTR expression compared to WT levels from N=12 WT, N=5 Egr1−/−, N=7 Egr3−/−, and N=5 Egr 1/3 DKO sciatic nerves; * = p < 0.05; Student’s t test compared to the level of p75NTR expression in WT nerves) (E) p75NTR protein deregulation is confirmed in 1/3DKO mouse sciatic nerves compared to wild type. Moreover, in the absence of both Egr1 and Egr3, there is no change in the level of Egr2 protein, a closely related transcriptional regulator known to be essential for peripheral nerve myelination. (F) The results are confirmed by densitometry analysis which shows a 42% decrease in p75NTR protein levels in 1/3 DKO sciatic nerves compared to WT. (results represent mean ± standard deviation of p75NTR protein compared between WT (N=4) and 1/3 DKO (N=4) sciatic nerves; * = p < 0.05; Student’s t test; scale bar = 20μm).
Figure 8
Figure 8
Diminished peripheral nerve myelination in Egr1/3 DKO mice. Compared to (A) WT axons, (B) 1/3 DKO peripheral axons have thinner myelin sheaths (P6 sciatic nerve shown). (C) While axon diameter is not significantly different between WT and 1/3 DKO sciatic nerves, there is (D) a significant decease in myelin thickness in 1/3 DKO nerves. (E) Morphometric analysis shows a quantitative decrease in myelin thickness (increased g-ratio) across all axon diameters. The least squares fit of the data (dashed and solid lines) show a significant increase in axon g-ratio in 1/3 DKO sciatic nerves compared to WT. (morphometry results of 1500–1800 axons analyzed from 3 animals of each genotype; * = p < 0.05; Student’s t test; scale bar = 10μm)

Similar articles

Cited by

References

    1. Albert Y, Whitehead J, Eldredge L, Carter J, Gao X, Tourtellotte WG. Transcriptional regulation of myotube fate specification and intrafusal muscle fiber morphogenesis. J Cell Biol. 2005;169:257–268. - PMC - PubMed
    1. Barker PA. p75NTR is positively promiscuous: novel partners and new insights. Neuron. 2004;42:529–533. - PubMed
    1. Beattie MS, Harrington AW, Lee R, Kim JY, Boyce SL, Longo FM, Bresnahan JC, Hempstead BL, Yoon SO. ProNGF induces p75-mediated death of oligodendrocytes following spinal cord injury. Neuron. 2002;36:375–386. - PMC - PubMed
    1. Beckmann AM, Wilce PA. Egr transcription factors in the nervous system. Neurochemistry international. 1997;31:477–510. discussion 517–476. - PubMed
    1. Benedetti M, Levi A, Chao MV. Differential expression of nerve growth factor receptors leads to altered binding affinity and neurotrophin responsiveness. Proc Natl Acad Sci U S A. 1993;90:7859–7863. - PMC - PubMed

Publication types

MeSH terms

Substances