. 2007 Oct;5(10):1207-1213.e2.
doi: 10.1016/j.cgh.2007.06.012.

Assessment of hepatic fibrosis with magnetic resonance elastography

Affiliations

Assessment of hepatic fibrosis with magnetic resonance elastography

Meng Yin et al. Clin Gastroenterol Hepatol. 2007 Oct.

Abstract

Background & aims: Accurate detection of hepatic fibrosis is crucial for assessing prognosis and candidacy for treatment in patients with chronic liver disease. Magnetic resonance (MR) elastography, a technique for quantitatively assessing the mechanical properties of soft tissues, has been shown previously to have potential for noninvasively detecting liver fibrosis. The goal of this work was to obtain preliminary estimates of the sensitivity and specificity of the technique in diagnosing liver fibrosis, and to assess its potential for identifying patients who potentially can avoid a biopsy procedure.

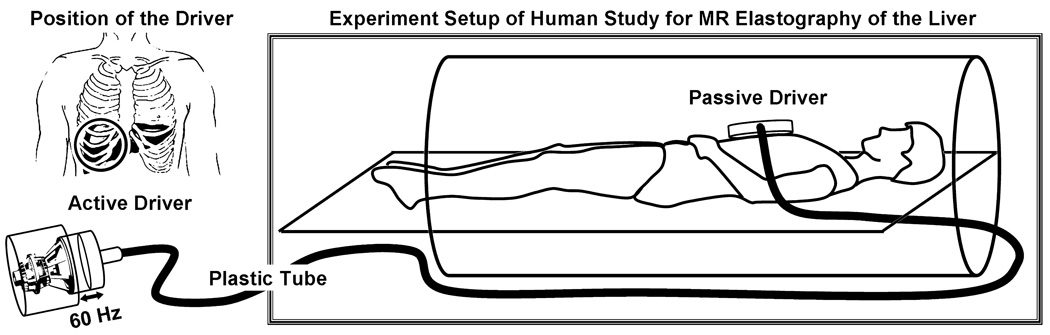
Methods: MR elastography was performed in 35 normal volunteers and 50 patients with chronic liver disease. MR imaging measurements of hepatic fat to water ratios were obtained to assess the potential for fat infiltration to affect stiffness-based detection of fibrosis.

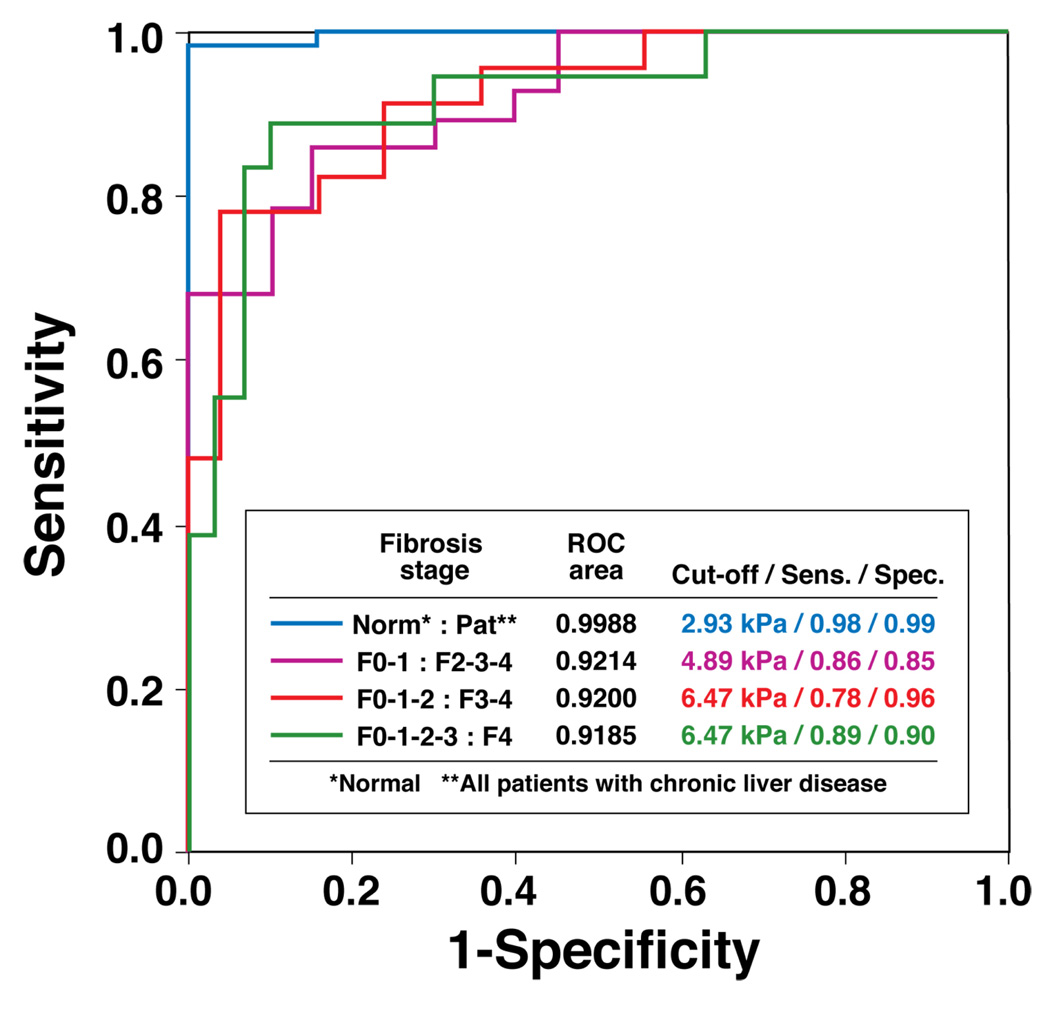
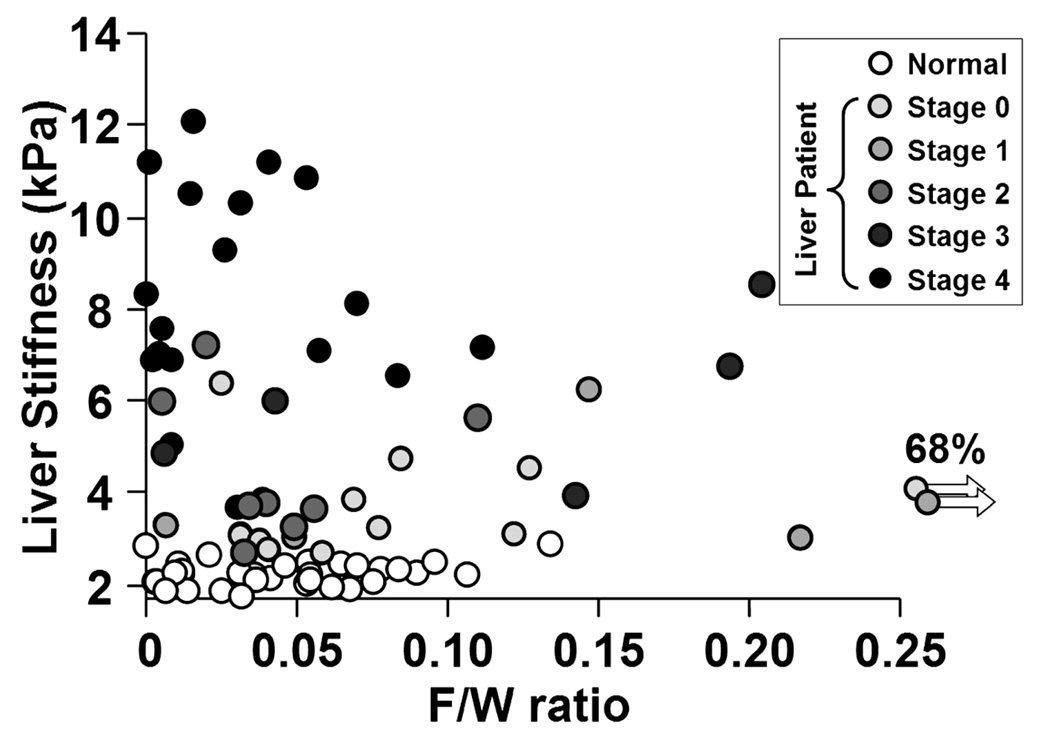
Results: Liver stiffness increased systematically with fibrosis stage. Receiver operating curve analysis showed that, with a shear stiffness cut-off value of 2.93 kilopascals, the predicted sensitivity and specificity for detecting all grades of liver fibrosis is 98% and 99%, respectively. Receiver operating curve analysis also provided evidence that MR elastography can discriminate between patients with moderate and severe fibrosis (grades 2-4) and those with mild fibrosis (sensitivity, 86%; specificity, 85%). Hepatic stiffness does not appear to be influenced by the degree of steatosis.

Conclusions: MR elastography is a safe, noninvasive technique with excellent diagnostic accuracy for assessing hepatic fibrosis. Based on the high negative predictive value of MR elastography, an initial clinical application may be to triage patients who are under consideration for biopsy examination to assess possible hepatic fibrosis.


Conflict of interest statement

Conflicts of interests: PJR and RLE and their institution hold patents related to this technology and have a potential financial interest in this research.

Figures

Figure 1
Figure 1. System for applying shear waves to the abdomen for MR Elastography of the liver
Acoustic pressure waves (at 60 Hz) are generated by an active audio driver, located away from the magnetic field of the MRI unit, and transmitted via a flexible tube to a passive pneumatic driver placed over the anterior body wall. The left diagram is a coronal illustration of the location of the passive pneumatic driver (circle) with respect to the liver.
Figure 2
Figure 2. MR Elastography of the liver in a normal volunteer and a patient with cirrhosis
Anatomic images of a normal volunteer and a patient with grade 4 fibrosis are shown in the far left column. The middle column of images shows wave image data in the liver and spleen, superimposed on the corresponding anatomic images. The resulting elastograms are shown in the far right column. The wave images show that the shear wavelength was higher in the fibrotic liver than in the normal liver. The elastograms show that the mean shear stiffness of the fibrotic liver was much higher than that of the normal liver (12.1 ± 1.2 kPa versus 1.8 ± 0.3 kPa, respectively).
Figure 3
Figure 3. MR Elastography of the liver is applicable to patients with obesity and ascites
The top row demonstrates MR Elastography in a liver fibrosis patient also suffering from obesity. The mean thickness of the body wall is 6 cm (BMI = 36) and yet the wave image shown in the middle shows that shear waves were still generated within the abdomen by the external driver. This patient with fibrosis stage 2 had a mean liver stiffness of 3.2 ± 0.8 kPa. The bottom row illustrates application of the technique in a patient with ascites, as demonstrated in the the T2-weighted images on the far left. Excellent shear wave illumination of the liver was obtained, and in this patient with fibrosis stage 4, the mean shear stiffness of the liver was 11.3 ± 2.8 kPa.
Figure 4
Figure 4. Mean liver stiffness increases with the increased fibrosis stage in patients
Shown is a summary of the mean shear stiffness measurements of the liver for the 35 normal volunteers and the 48 patients divided into the five different fibrosis stages, which are indicated as F0, F1 … F4. Liver stiffness is significantly higher in patients than in the control group. The standard errors for each group are also illustrated in error bar for each group. An exponential function fit well to the liver stiffness data with an R² value of 0.94.
Figure 5
Figure 5. Liver stiffness increases significantly with increased fibrosis extent determined by liver biopsy
In the left diagram, significant differences (marked with star *) are observed in the liver stiffness between the normal control group and patient groups F0-1-2, F3, and F4. The p-values are all less than 0.0001. The confidence interval diamonds are shown for each group. In the right diagram, significant difference is also observed between the mild fibrosis groups (F0-1-2) and the severe fibrosis groups (F3-4). The p-value is less than 0.05. The center and the radius of the three circles indicate the mean and standard deviation of the normal, F0-1-2, and F3-4 fibrosis groups. The data were analyzed with a Kruskal-Wallis test followed by Dunnett’s test.
Figure 6
Figure 6. ROC analysis of the diagnostic ability of MR Elastography for hepatic fibrosis
Four ROC curves are illustrated to indicate the ability of this MR Elastography protocol to distinguish different fibrosis stages. The accompanying table shows the values for the AUC (area under the ROC curve), the optimal cut-off liver stiffness, and the corresponding sensitivity and specificity using the optimal cut-off stiffness for each test.
Figure 7
Figure 7. No correlations were observed between the F/W ratios and the liver stiffness measurements in normal volunteers and each fibrosis groups
Linear regressions were used to evaluate the possible correlation between the hepatic F/W ratios and the liver stiffness measurements for the normals and the patients. Since the R² values are all less than 0.05, no significant correlations were found.
Appendix Figure
Appendix Figure. Gradient echo MR Elastography sequence
This sequence is a conventional gradient echo sequence with an additional motion encoding gradient (MEG) applied along the slice-selection direction (Gz) to detect cyclic motion in the through-plane direction. The MEG was designed to minimize zeroth and first gradient moments. The MEG and the acoustic driver are synchronized using trigger pulses provided by the imager. The phase offset (θ) between the two can be adjusted to acquire wave images at different phases of the cyclic motion.

Comment in

Similar articles

Cited by

References

    1. Kim WR, Brown RS, Jr, Terrault NA, El-Serag H. Burden of liver disease in the United States: summary of a workshop. Hepatology. 2002;36:227–242. - PubMed
    1. Shaheen NJ, Hansen RA, Morgan DR, Gangarosa LM, Ringel Y, Thiny MT, Russo MW, et al. The burden of gastrointestinal and liver diseases, 2006. Am J Gastroenterol. 2006;101:2128–2138. - PubMed
    1. Davis GL, Albright JE, Cook SF, Rosenberg DM. Projecting future complications of chronic hepatitis C in the United States. Liver Transpl. 2003;9:331–338. - PubMed
    1. Charlton M. Nonalcoholic fatty liver disease: a review of current understanding and future impact. Clin Gastroenterol Hepatol. 2004;2:1048–1058. - PubMed
    1. Standish RA, Cholongitas E, Dhillon A, Burroughs AK, Dhillon AP. An appraisal of the histopathological assessment of liver fibrosis. Gut. 2006;55:569–578. - PMC - PubMed

Publication types