. 2008 Jan;149(1):161-73.
doi: 10.1210/en.2007-0938. Epub 2007 Oct 4.

Molecular cloning and characterization of estrogen, androgen, and progesterone nuclear receptors from a freshwater turtle (Pseudemys nelsoni)

Affiliations

Molecular cloning and characterization of estrogen, androgen, and progesterone nuclear receptors from a freshwater turtle (Pseudemys nelsoni)

Yoshinao Katsu et al. Endocrinology. 2008 Jan.

Abstract

Steroid hormones are essential for the normal function of many organ systems in vertebrates. Reproductive activity in females and males, such as the differentiation, growth, and maintenance of the reproductive system, requires signaling by the sex steroids. Although extensively studied in mammals and a few fish, amphibians, and bird species, the molecular mechanisms of sex steroid hormone (estrogens, androgens, and progestins) action are poorly understood in reptiles. Here we evaluate hormone receptor ligand interactions in a freshwater turtle, the red-belly slider (Pseudemys nelsoni), after the isolation of cDNAs encoding an estrogen receptor alpha (ERalpha), an androgen receptor (AR), and a progesterone receptor (PR). The full-length red-belly slider turtle (t)ERalpha, tAR, and tPR cDNAs were obtained using 5' and 3' rapid amplification cDNA ends. The deduced amino acid sequences showed high identity to the chicken orthologs (tERalpha, 90%; tAR, 71%; tPR, 71%). Using transient transfection assays of mammalian cells, tERalpha protein displayed estrogen-dependent activation of transcription from an estrogen-responsive element-containing promoter. The other receptor proteins, tAR and tPR, also displayed androgen- or progestin-dependent activation of transcription from androgen- and progestin-responsive murine mammary tumor virus promoters. We further examined the transactivation of tERalpha, tAR and tPR by ligands using a modified GAL4-transactivation system. We found that the GAL4-transactivation system was not suitable for the measurement of tAR and tPR transactivations. This is the first report of the full coding regions of a reptilian AR and PR and the examination of their transactivation by steroid hormones.


Figures
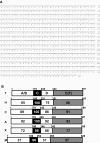
Figure 1
Figure 1
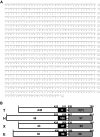
The turtle ERα. A, The deduced amino acid sequence of tERα. Numbers on the side represent the position of amino acid residues in sequence. B, Comparison of tERα protein with ERs of several species (H, human; C, chicken; A, American alligator; X, X. leavis; M, medaka; GenBank accession nos. are: human ERα, P03372; chicken ERα, P06212; Xenopus ERα, P81559; medaka ERα, D28954; and American alligator ERα, BAD08348). The functional A/B to F domains are schematically represented with the numbers of amino acid residues indicated.
Figure 2
Figure 2
Phylogenetic trees of predicted amino acid sequences based on the hinge and ligand-binding regions of ERα (A), AR (B), or PR (C). The trees were constructed using the maximal likelihood method with the JTT model and the bootstrap resampling (1000 times). Branch lengths reflect estimated numbers of substitutions along each branch. The scale bar indicates 0.05 expected amino acid substitutions per site. The width of branches indicates reliability (bootstrap value) of tree branching.
Figure 3
Figure 3
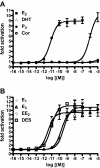
Transcriptional activities of tERα. (A) Transcriptional activities of tERα for various steroids. HEK293 cells were transiently transfected with the ERE-containing vector together with a tERα expression vector. Cells were incubated with increasing concentrations of E2 (10−16 to 10−7 m), DHT (10−15 to 10−5 m), P4 (10−15 to 10−5 m), and Cor (10−15 to 10−5 m). Data are expressed as a ratio of steroid to vehicle (DMSO). Each column represents the mean of triplicate determinations, and vertical bars represent the mean ± se. B, Dose-response profile of tERα activation by estrogens. HEK293 cells were transiently transfected with the ERE-containing vector together with a tERα expression vector. Cells were incubated with increasing concentrations of E1/E3 (10−15 to 10−5 m), and EE2/DES (10−16 to 10−7 m), Each point represents the mean of triplicate determinations, and vertical bars represent the mean ± se.
Figure 4
Figure 4
Nucleotide sequence and the deduced amino acid sequence (A) and structure comparison (B) with other species of tAR. A, The numbers on the right refer to the position of the nucleotides and the amino acids. The functional A/B to E/F domains of tAR is schematically represented with the numbers of amino acid residues. Percent homology of the domain relative to the turtle AR is depicted. E, Eel; H, human; T, turtle; X, Xenopus. GenBank accession nos. are: human AR, P10275; Xenopus AR, AAC97386; eel AR1, AB023960; and eel AR2, AB025361.
Figure 5
Figure 5
Transcriptional activities of tAR. A, Transcriptional activities of tAR for various steroids. HepG2 cells were transiently transfected with the MMTV-luciferase vector together with a tAR expression vector. Cells were incubated with increasing concentrations of E2/P4/Cor (10−15 to 10−5 m) or DHT (10−17 to 10−7 m). Data are expressed as a ratio of steroid to vehicle (DMSO). Each column represents the mean of triplicate determinations, and vertical bars represent the mean ± se. B, Dose-response profile of tAR activation by androgens MT, Tre, AD, and T. Each point represents the mean of triplicate determinations, and vertical bars present the mean ± se.
Figure 6
Figure 6
Nucleotide sequence and the deduced amino acid sequence (A) and structure comparison (B) with other species of tPR. A, The numbers on the right refer to the position of the nucleotides and the amino acids. The functional A/B to E/F domains of tPR is schematically represented with the numbers of amino acid residues. Percent homology of the domain relative to the tPR is depicted. C, Chicken; E, Eel; H, human; T, turtle; X, Xenopus. GenBank accession nos. are: human PR, P06401; chicken PR, P07812; Xenopus PR, AAH68635; eel PR1, AB032075; and eel PR2, AB028024.
Figure 7
Figure 7
Transcriptional activities of tPR. A, Transcriptional activities of tPR for various steroids. HepG2 cells were transiently transfected with the MMTV-luciferase vector together with a tPR expression vector. Cells were incubated with increasing concentrations of E2/DHT/Cor (10−15 to 10−5 m) or P4 (10−16 to 10−6 m). Data are expressed as a ratio of steroid to vehicle (DMSO). Each column represents the mean of triplicate determinations, and vertical bars represent the mean ± se. B, Dose-response profile of tPR activation by 17OH-Preg, 17OH-Prog, and Preg. Each point represents the mean of triplicate determinations, and vertical bars present the mean ± se.
Figure 8
Figure 8
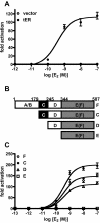
Transcriptional activities of tERα using GAL4 system. A, CHO-K1 cells were transiently transfected with the pBIND or pBIND-tERα together with pG5-luc vector. Cells were incubated with increasing concentrations of E2 (10−12 to 10−7 m). Each point represents the mean of the triplicate determinations, and vertical bars present the mean ± se. B, Schematic representation of tERα deletion mutants used in this study. C, Dose-response profile of tERα activation by E2. CHO-K1 cells were transiently transfected with the pG5-luc vector together with N-terminal deletion constructs of tERα expression vector. Cells were incubated with increasing concentrations of E2 (10−13 to 10−7 m). Each point represents the mean of the triplicate determinations, and vertical bars present the mean ± se.
Figure 9
Figure 9
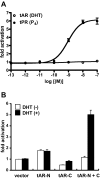
Transcriptional activities of tAR and tPR. A, Dose-response profile of tAR and tPR activation. CHO-K1 cells were transiently transfected with the pG5-luc vector together with a tPR expression vector (tPR, •) or a tAR expression vector (tAR, ○). Cells were incubated with increasing concentrations of P4 for tPR or DHT for tAR (10−13 to 10−7 m). Each point represents the mean of the triplicate determinations, and vertical bars present the mean ± se. B, Transcriptional activity of tAR was determined in CHO-K1 cells transiently transfected with reporter MMTV-luc construct. After transfection, cells were incubated with (black bar) or without (white bar) 10−8 m DHT. Each point represents the mean of the triplicate determinations, and vertical bars present the mean ± se.

Similar articles

Cited by

References

    1. Blumberg B, Evans RM 1998 Orphan nuclear receptors: new ligands and new possibilities. Gene Dev 12:3149–3155 - PubMed
    1. Hawkins MB, Thornton JW, Crews D, Skipper JK, Dotte A, Thomas P 2000 Identification of a third estrogen receptor and reclassification of estrogen receptors in teleosts. Proc Natl Acad Sci USA 97:10751–10756 - PMC - PubMed
    1. Thornton JW 2001 Evolution of vertebrate steroid receptors from an ancestral estrogen receptor by ligand exploitation and serial genome expansions. Proc Nat Acad Sci USA 98:5671–5676 - PMC - PubMed
    1. Katsu Y, Bermudez DS, Braun E, Helbing C, Miyagawa S, Gunderson MP, Kohno S, Bryan TA, Guillette LJ, Iguchi T 2004 Molecular cloning of the estrogen and progesterone receptors of the American alligator. Gen Comp Endocrinol 136:122–133 - PubMed
    1. Katsu Y, Kohno S, Oka T, Mitsui N, Tooi O, Santo N, Urushitani H, Fukumoto Y, Kuwabara K, Ashikaga K, Minami S, Kato S, Ohta Y, Guillette LJ, Iguchi T 2006 Molecular cloning of estrogen receptor α (ERα; ESR1) of the Japanese giant salamander, Andrias japonicus. Mol Cell Endocrinol 257–258:84–94 - PubMed

Publication types