

A density-based proteomics sample fractionation technology: folate deficiency induced oxidative stress response in liver and brain
- PMID: 17916794
- PMCID: PMC2062558
A density-based proteomics sample fractionation technology: folate deficiency induced oxidative stress response in liver and brain
Abstract
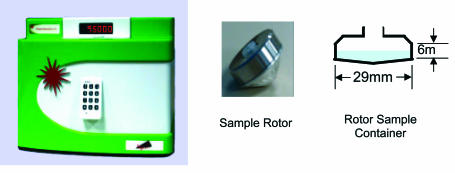
Folate deficiency (FD) alters hepatic methionine metabolism and is associated with increased hepatocellular apoptosis. Additionally, mice deprived of folate showed increased oxidative damage in brain tissue, leading to cognitive impairment. Most previous studies have focused independently on either liver, the main tissue of folate storage and metabolism, or brain, where folate regulates neurogenesis and programs cell death. The aim of this study was to apply a powerful, rapid proteomics approach to understand potential subcellular correlations of folate deficiency in both brain and liver of the same rat. This approach combined a new density-based sample fractionation technology (enhanced density gradient extraction = Edge technology) with other conventional proteomics techniques, such as western blot analysis, 2DE, and mass spectrometry. The brain and the liver from individual rats, fed normal or FD diets for 6 wks, were homogenized and then fractionated using the Edge 200 Separation System. Subsequently, all fractions from brain and liver, from control and treated rats, were analyzed by western blot using two markers of oxidative stress: glutathione peroxidase 1 (GPx1) and glucose-regulated protein 75 (GRP75). certain fractions were selected based on western blot analysis and were further analyzed by 2DE. protein spots of interest were identified by MALDI-TOF/TOF. The results demonstrated that edge technology provides a powerful density based separation and enrichment method for rapid screening of potential FD markers and their possible correlations to both liver and brain diseases.
Figures


Similar articles
-
Proteomic analysis reveals changes in the liver protein pattern of rats exposed to dietary folate deficiency.J Nutr. 2005 Nov;135(11):2524-9. doi: 10.1093/jn/135.11.2524. J Nutr. 2005. PMID: 16251605
-
Disruption of lipid metabolism in the liver of the pregnant rat fed folate-deficient and methyl donor-deficient diets.Br J Nutr. 2008 Feb;99(2):262-71. doi: 10.1017/S0007114507798999. Epub 2007 Aug 13. Br J Nutr. 2008. PMID: 17697402
-
Folate deprivation promotes mitochondrial oxidative decay: DNA large deletions, cytochrome c oxidase dysfunction, membrane depolarization and superoxide overproduction in rat liver.Br J Nutr. 2007 May;97(5):855-63. doi: 10.1017/S0007114507666410. Br J Nutr. 2007. PMID: 17381984
-
Folate deficiency, methionine metabolism, and alcoholic liver disease.Alcohol. 2002 Jul;27(3):169-72. doi: 10.1016/s0741-8329(02)00225-2. Alcohol. 2002. PMID: 12163145 Review.
-
2D gel proteomics: an approach to study age-related differences in protein abundance or isoform complexity in biological samples.Methods Mol Biol. 2007;371:349-91. doi: 10.1007/978-1-59745-361-5_24. Methods Mol Biol. 2007. PMID: 17634592 Review.
Cited by
-
High-dose folic acid supplementation results in significant accumulation of unmetabolized homocysteine, leading to severe oxidative stress in Caenorhabditis elegans.Redox Biol. 2020 Oct;37:101724. doi: 10.1016/j.redox.2020.101724. Epub 2020 Sep 15. Redox Biol. 2020. PMID: 32961438 Free PMC article.
-
The use of neuroproteomics in drug abuse research.Drug Alcohol Depend. 2010 Feb 1;107(1):11-22. doi: 10.1016/j.drugalcdep.2009.10.001. Epub 2009 Nov 17. Drug Alcohol Depend. 2010. PMID: 19926406 Free PMC article. Review.
-
Systemic vitamin intake impacting tissue proteomes.Nutr Metab (Lond). 2020 Aug 26;17:73. doi: 10.1186/s12986-020-00491-7. eCollection 2020. Nutr Metab (Lond). 2020. PMID: 32863845 Free PMC article. Review.
-
Methotrexate induces oxidative DNA damage and is selectively lethal to tumour cells with defects in the DNA mismatch repair gene MSH2.EMBO Mol Med. 2009 Sep;1(6-7):323-37. doi: 10.1002/emmm.200900040. EMBO Mol Med. 2009. PMID: 20049736 Free PMC article.
References
-
- Mattson MP, Shea TB. Folate and homocysteine metabolism in neural plasticity and neurodegenerative disorders. Trends Neurosci. 2003;26(3):137–146. - PubMed
-
- Clarke R, Smith AD, Jobst KA, Refsum H, Sutton L, Ueland PM. Folate, vitamin B12, and serum total homocysteine levels in confirmed Alzheimer’s disease. Arch Neurol. 1998;55:1449–1455. - PubMed
-
- Ebly EM, Schaefer JP, Campbell NR, Hogan DB. Folate status, vascular disease, and cognition in elderly Canadians. Age Aging. 1998;27:485–491. - PubMed
-
- Hassing L, Wahlin A, Winblad B, Bäckman L. Further evidence on the effects of vitamin B12 and folate levels on episodic memory functioning: A population-based study of healthy very old adults. Biol Psych. 1999;45:1472–1480. - PubMed
MeSH terms
LinkOut - more resources
Full Text Sources
Medical
Miscellaneous