

Synthetic ligands discovered by in vitro selection
- PMID: 17918937
- PMCID: PMC2535576
- DOI: 10.1021/ja073993a
Synthetic ligands discovered by in vitro selection
Abstract
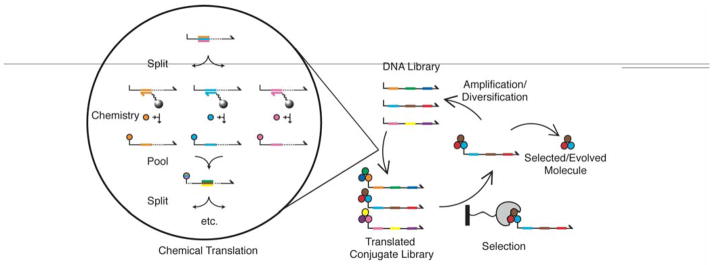
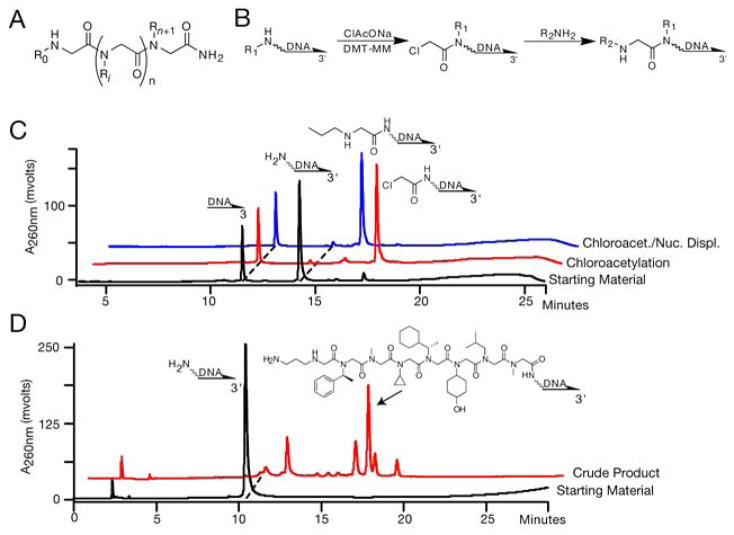
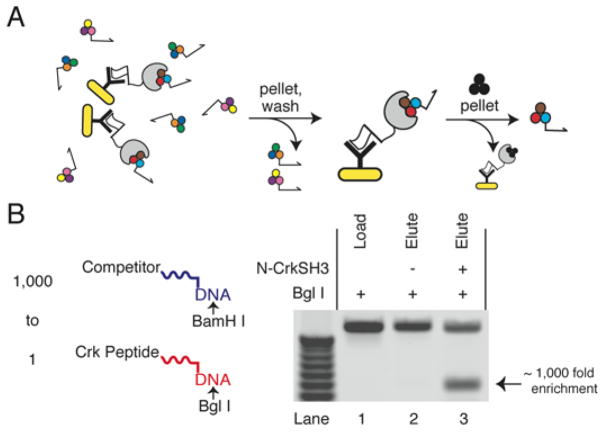
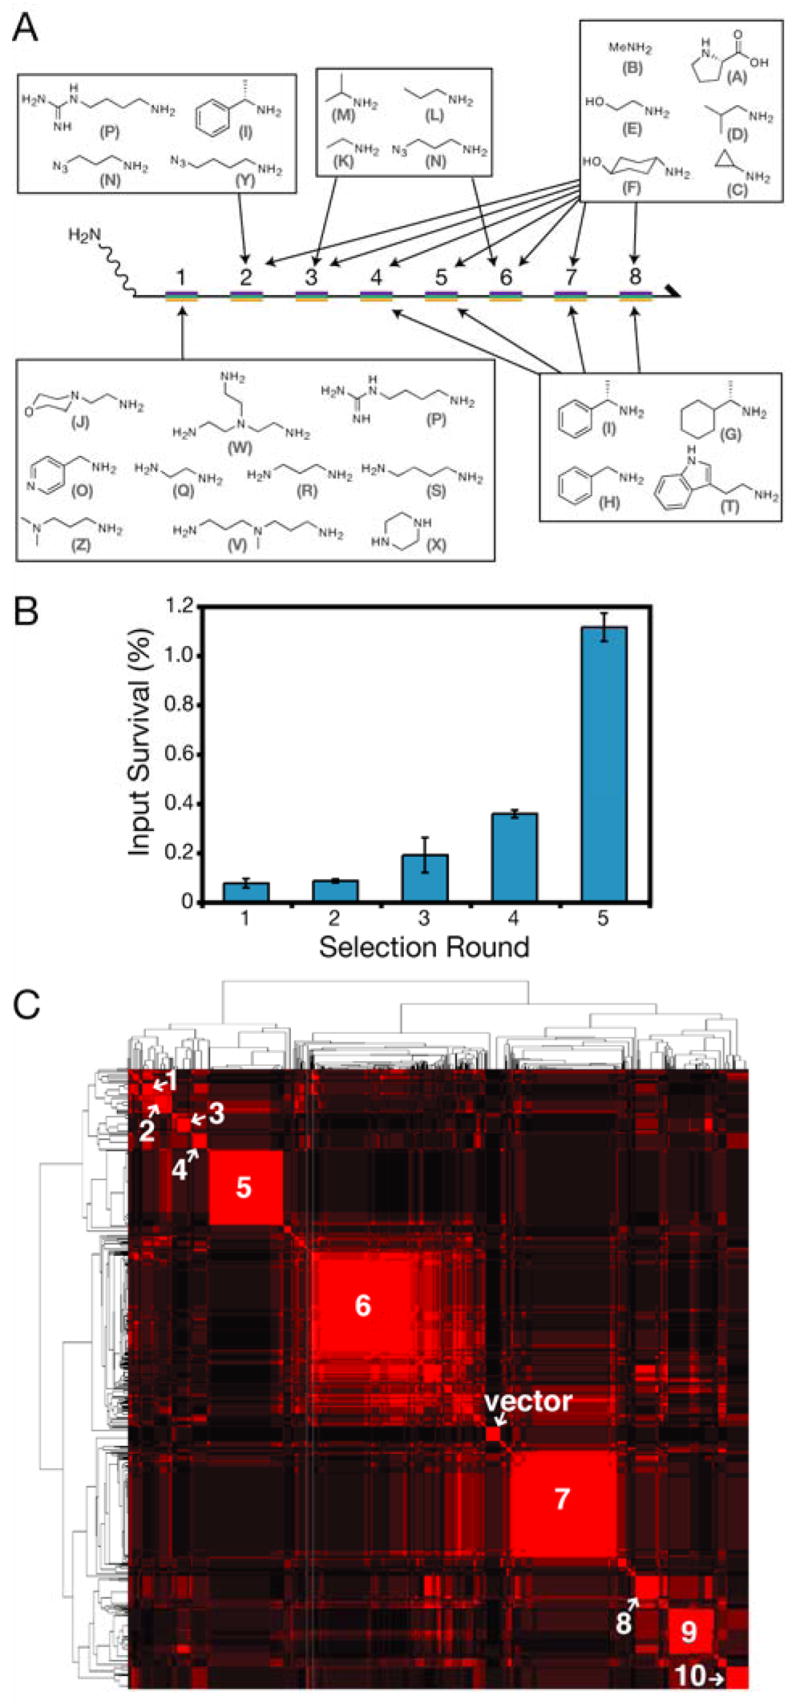
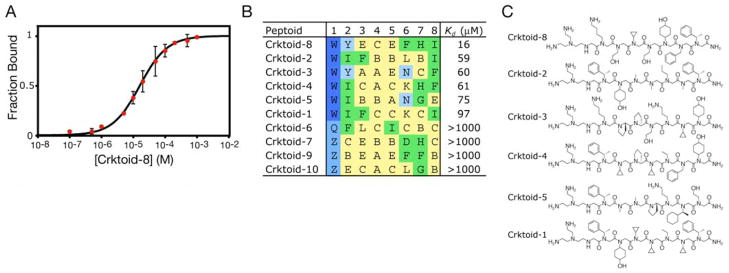
The recognition and catalytic properties of biopolymers derive from an elegant evolutionary mechanism, whereby the genetic material encoding molecules with superior functional attributes survives a selective pressure and is propagated to subsequent generations. This process is routinely mimicked in vitro to generate nucleic-acid or peptide ligands and catalysts. Recent advances in DNA-programmed organic synthesis have raised the possibility that evolutionary strategies could also be used for small-molecule discovery, but the idea remains unproven. Here, using DNA-programmed combinatorial chemistry, a collection of 100 million distinct compounds is synthesized and subjected to selection for binding to the N-terminal SH3 domain of the proto-oncogene Crk. Over six generations, the molecular population converges to a small number of novel SH3 domain ligands. Remarkably, the hits bind with affinities similar to those of peptide SH3 ligands isolated from phage libraries of comparable complexity. The evolutionary approach has the potential to drastically simplify and accelerate small-molecule discovery.
Figures
Similar articles
-
Distinct ligand preferences of Src homology 3 domains from Src, Yes, Abl, Cortactin, p53bp2, PLCgamma, Crk, and Grb2.Proc Natl Acad Sci U S A. 1996 Feb 20;93(4):1540-4. doi: 10.1073/pnas.93.4.1540. Proc Natl Acad Sci U S A. 1996. PMID: 8643668 Free PMC article.
-
The SH3 domain of Crk binds specifically to a conserved proline-rich motif in Eps15 and Eps15R.J Biol Chem. 1995 Jun 23;270(25):15341-7. doi: 10.1074/jbc.270.25.15341. J Biol Chem. 1995. PMID: 7797522
-
Identification of Src, Fyn, Lyn, PI3K and Abl SH3 domain ligands using phage display libraries.EMBO J. 1994 Dec 1;13(23):5598-604. doi: 10.1002/j.1460-2075.1994.tb06897.x. EMBO J. 1994. PMID: 7988556 Free PMC article.
-
DNA-Encoded Chemical Libraries: A Selection System Based on Endowing Organic Compounds with Amplifiable Information.Annu Rev Biochem. 2018 Jun 20;87:479-502. doi: 10.1146/annurev-biochem-062917-012550. Epub 2018 Jan 12. Annu Rev Biochem. 2018. PMID: 29328784 Free PMC article. Review.
-
Chemical evolution as a tool for molecular discovery.Annu Rev Biochem. 2007;76:331-49. doi: 10.1146/annurev.biochem.76.062205.122741. Annu Rev Biochem. 2007. PMID: 17506635 Review.
Cited by
-
Synthesis and screening of stereochemically diverse combinatorial libraries of peptide tertiary amides.Chem Biol. 2013 Mar 21;20(3):360-9. doi: 10.1016/j.chembiol.2013.01.013. Chem Biol. 2013. PMID: 23521794 Free PMC article.
-
Chemical Tools To Monitor and Manipulate Adaptive Immune Responses.J Am Chem Soc. 2016 May 18;138(19):6076-94. doi: 10.1021/jacs.6b02954. Epub 2016 May 3. J Am Chem Soc. 2016. PMID: 27115249 Free PMC article. Review.
-
Translation of DNA into a library of 13,000 synthetic small-molecule macrocycles suitable for in vitro selection.J Am Chem Soc. 2008 Nov 19;130(46):15611-26. doi: 10.1021/ja805649f. Epub 2008 Oct 29. J Am Chem Soc. 2008. PMID: 18956864 Free PMC article.
-
Small-molecule discovery through DNA-encoded libraries.Nat Rev Drug Discov. 2023 Sep;22(9):699-722. doi: 10.1038/s41573-023-00713-6. Epub 2023 Jun 16. Nat Rev Drug Discov. 2023. PMID: 37328653 Free PMC article. Review.
-
Scanning Protein Surfaces with DNA-Encoded Libraries.ChemMedChem. 2021 Apr 8;16(7):1048-1062. doi: 10.1002/cmdc.202000869. Epub 2020 Dec 28. ChemMedChem. 2021. PMID: 33295694 Free PMC article. Review.
References
Publication types
MeSH terms
Substances
Grants and funding
LinkOut - more resources
Full Text Sources
Other Literature Sources
