

Assessment of bronchial wall thickness and lumen diameter in human adults using multi-detector computed tomography: comparison with theoretical models
- PMID: 17919291
- PMCID: PMC2375785
- DOI: 10.1111/j.1469-7580.2007.00811.x
Assessment of bronchial wall thickness and lumen diameter in human adults using multi-detector computed tomography: comparison with theoretical models
Abstract
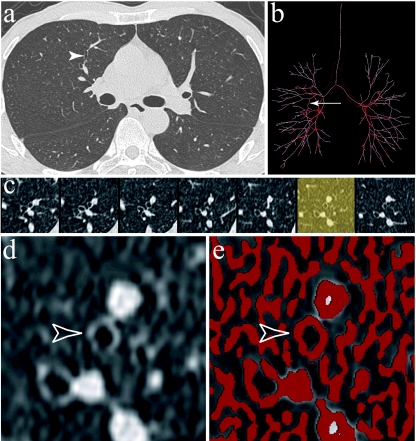
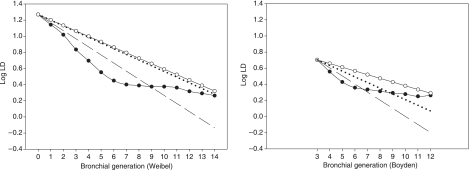
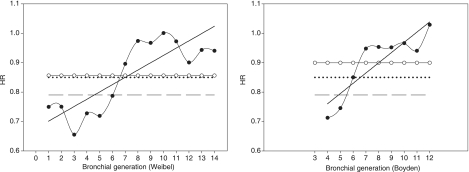
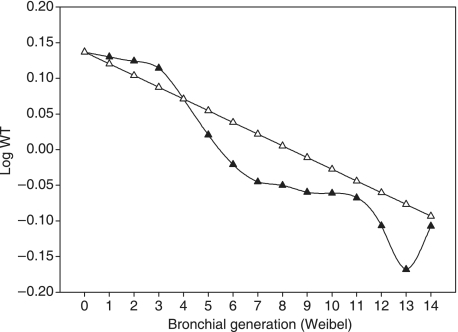
A thickened bronchial wall is the morphological substratum of most diseases of the airway. Theoretical and clinical models of bronchial morphometry have so far focused on bronchial lumen diameter, and bronchial length and angles, mainly assessed from bronchial casts. However, these models do not provide information on bronchial wall thickness. This paper reports in vivo values of cross-sectional wall area, lumen area, wall thickness and lumen diameter in ten healthy subjects as assessed by multi-detector computed tomography. A validated dedicated software package was used to measure these morphometric parameters up to the 14th bronchial generation, with respect to Weibel's model of bronchial morphometry, and up to the 12th according to Boyden's classification. Measured lumen diameters and homothety ratios were compared with theoretical values obtained from previously published studies, and no difference was found when considering dichotomic division of the bronchial tree. Mean wall area, lumen area, wall thickness and lumen diameter were then provided according to bronchial generation order, and mean homothety ratios were computed for wall area, lumen area and wall thickness as well as equations giving the mean value of each parameter for a given bronchial generation with respect to its value in generation 0 (trachea). Multi-detector computed tomography measurements of bronchial morphometric parameters may help to improve our knowledge of bronchial anatomy in vivo, our understanding of the pathophysiology of bronchial diseases and the evaluation of pharmacological effects on the bronchial wall.
Figures
Similar articles
-
Assessment of airways with three-dimensional quantitative thin-section CT: in vitro and in vivo validation.Radiology. 2007 Feb;242(2):563-72. doi: 10.1148/radiol.2422060029. Epub 2006 Dec 19. Radiology. 2007. PMID: 17179398
-
Airway dimensions in asthma and COPD in high resolution computed tomography: can we see the difference?Respir Care. 2013 Aug;58(8):1335-42. doi: 10.4187/respcare.02175. Epub 2013 Jan 9. Respir Care. 2013. PMID: 23307823
-
Bronchial measurement with three-dimensional quantitative thin-section CT in patients with cystic fibrosis.Radiology. 2007 Feb;242(2):573-81. doi: 10.1148/radiol.2422060030. Epub 2006 Dec 19. Radiology. 2007. PMID: 17179399
-
Multidetector CT-generated virtual bronchoscopy: an illustrated review of the potential clinical indications.Eur Respir J. 2004 May;23(5):776-82. doi: 10.1183/09031936.04.00099804. Eur Respir J. 2004. PMID: 15176696 Review.
-
Ultrasound measurement of wall thickness in the carotid artery: fundamental principles and description of a computerized analysing system.Clin Physiol. 1991 Nov;11(6):565-77. doi: 10.1111/j.1475-097x.1991.tb00676.x. Clin Physiol. 1991. PMID: 1769190 Review.
Cited by
-
A mechanical design principle for tissue structure and function in the airway tree.PLoS Comput Biol. 2013;9(5):e1003083. doi: 10.1371/journal.pcbi.1003083. Epub 2013 May 30. PLoS Comput Biol. 2013. PMID: 23737742 Free PMC article.
-
Computed Tomographic Airway Morphology in Chronic Obstructive Pulmonary Disease. Remodeling or Innate Anatomy?Ann Am Thorac Soc. 2016 Jan;13(1):4-9. doi: 10.1513/AnnalsATS.201506-371PP. Ann Am Thorac Soc. 2016. PMID: 26562761 Free PMC article. Review.
-
The Creation and Statistical Evaluation of a Deterministic Model of the Human Bronchial Tree from HRCT Images.PLoS One. 2016 Dec 15;11(12):e0168026. doi: 10.1371/journal.pone.0168026. eCollection 2016. PLoS One. 2016. PMID: 27977730 Free PMC article.
-
How severe acute respiratory syndrome coronavirus-2 aerosol propagates through the age-specific upper airways.Phys Fluids (1994). 2021 Aug;33(8):081911. doi: 10.1063/5.0061627. Epub 2021 Aug 19. Phys Fluids (1994). 2021. PMID: 34552312 Free PMC article.
-
A theoretical model of the application of RF energy to the airway wall and its experimental validation.Biomed Eng Online. 2010 Nov 27;9:81. doi: 10.1186/1475-925X-9-81. Biomed Eng Online. 2010. PMID: 21110893 Free PMC article.
References
-
- Bates JH. Stochastic model of the pulmonary airway tree and its implications for bronchial responsiveness. J Appl Physiol. 1993;75:2493–2499. - PubMed
-
- Berger P, Perot V, Desbarats P, Tunon-de-Lara JM, Marthan R, Laurent F. Airway wall thickness in cigarette smokers: quantitative thin-section CT assessment. Radiology. 2005;235:1055–1064. - PubMed
-
- Boser SR, Park H, Perry SF, Menache MG, Green FH. Fractal geometry of airway remodeling in human asthma. Am J Respir Crit Care Med. 2005;172:817–823. - PubMed
-
- Boyden EA. Segmental Anatomy of the Lungs. New York: Mc Graw-Hill; 1955.
-
- Brillet PY, Fetita CI, Beigelman-Aubry C, et al. Quantification of bronchial dimensions at MDCT using dedicated software. Eur Radiol. 2007;17:1483–1489. - PubMed
Publication types
MeSH terms
LinkOut - more resources
Full Text Sources
Other Literature Sources
Medical
