. 2007 Oct 5:8:373.
doi: 10.1186/1471-2105-8-373.

qPIPSA: relating enzymatic kinetic parameters and interaction fields

Affiliations

qPIPSA: relating enzymatic kinetic parameters and interaction fields

Razif R Gabdoulline et al. BMC Bioinformatics. .

Abstract

Background: The simulation of metabolic networks in quantitative systems biology requires the assignment of enzymatic kinetic parameters. Experimentally determined values are often not available and therefore computational methods to estimate these parameters are needed. It is possible to use the three-dimensional structure of an enzyme to perform simulations of a reaction and derive kinetic parameters. However, this is computationally demanding and requires detailed knowledge of the enzyme mechanism. We have therefore sought to develop a general, simple and computationally efficient procedure to relate protein structural information to enzymatic kinetic parameters that allows consistency between the kinetic and structural information to be checked and estimation of kinetic constants for structurally and mechanistically similar enzymes.

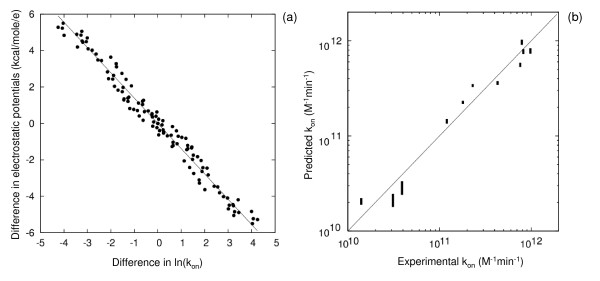
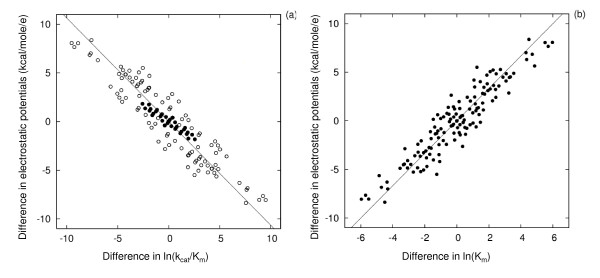
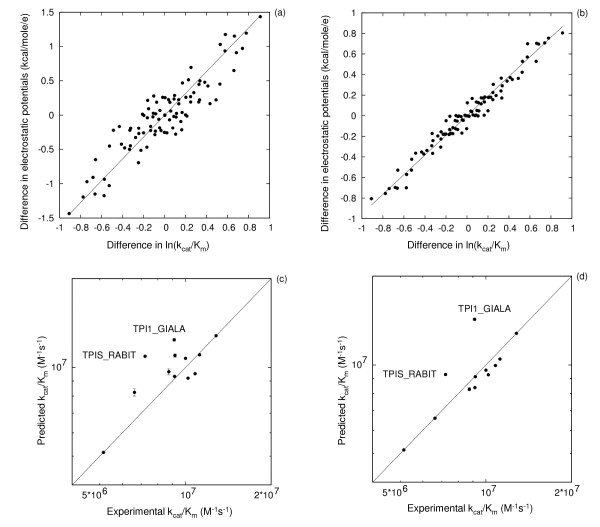
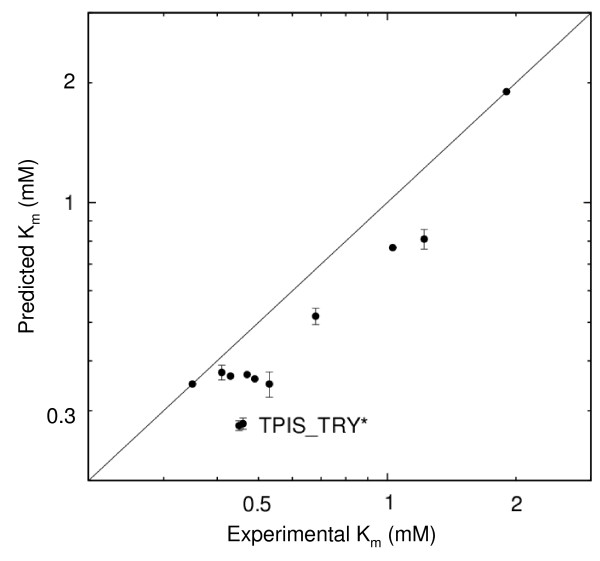
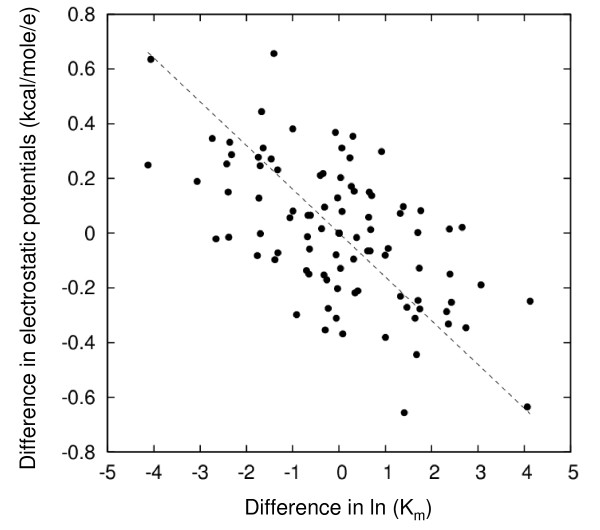
Results: We describe qPIPSA: quantitative Protein Interaction Property Similarity Analysis. In this analysis, molecular interaction fields, for example, electrostatic potentials, are computed from the enzyme structures. Differences in molecular interaction fields between enzymes are then related to the ratios of their kinetic parameters. This procedure can be used to estimate unknown kinetic parameters when enzyme structural information is available and kinetic parameters have been measured for related enzymes or were obtained under different conditions. The detailed interaction of the enzyme with substrate or cofactors is not modeled and is assumed to be similar for all the proteins compared. The protein structure modeling protocol employed ensures that differences between models reflect genuine differences between the protein sequences, rather than random fluctuations in protein structure.

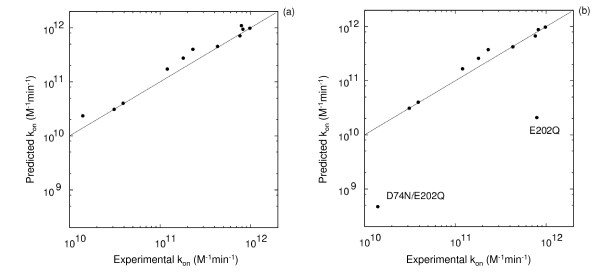
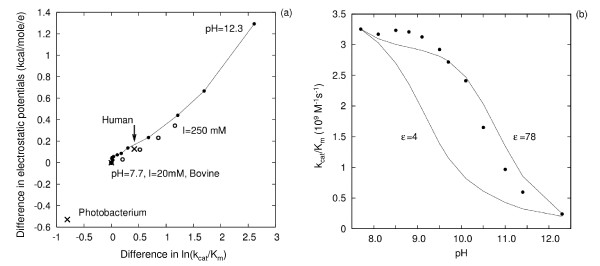
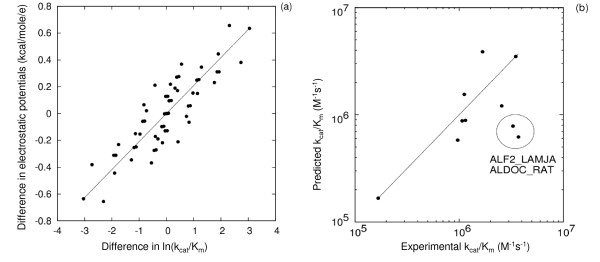
Conclusion: Provided that the experimental conditions and the protein structural models refer to the same protein state or conformation, correlations between interaction fields and kinetic parameters can be established for sets of related enzymes. Outliers may arise due to variation in the importance of different contributions to the kinetic parameters, such as protein stability and conformational changes. The qPIPSA approach can assist in the validation as well as estimation of kinetic parameters, and provide insights into enzyme mechanism.


Figures

Figure 1
Figure 1
(a) Correlation between the differences in experimental inhibitor ln(kon) and differences in electrostatic potentials of AchE and (b). leave-two-out cross-validation for prediction of kon values for the inhibitor TFK+ and AChE. Each point in part (a) represents a pair of AChE variants for which the natural log (ln) of the difference in association rate constant, kon, for the inhibitor TFK+ is plotted on the x-axis and the average electrostatic potential difference in the comparison region is plotted on the y-axis. The straight line corresponds to the best linear fit and is given by y = -1.39*x. The data are for wild-type AChE and 10 mutants (see Table 1, no konvalue for TFK+ is available for mutant 04). For leave-two-out cross-validation predictions presented in (b), 2 cases were omitted when deriving the correlation factor α in formula (1) and these 2 cases were predicted using formula (1) with the derived factor α. Predictions are shown as vertical lines connecting minimum and maximum values from all (55) different predictions.
Figure 2
Figure 2
Correlation between (a) experimental ln(kcat /Km and (b) experimental ln(Km for the substrate ATCh and electrostatic potential differences for different AChE mutants. Each point corresponds to the differences for one protein variant pair. The straight line corresponds to the best linear fit and is given by y = -1.06*x (a) and y = 1.68*x (b). In the panel (a) data for protein pairs that do not have active site residue mutations are shown by filled circles.
Figure 3
Figure 3
Importance of correct modeling of the protonation states of titratable residues for predicting of kon values for TFK+ and AChE . Predictions were made for 9 AChE mutants using known kon values for the wild-type and D74N/D280V/D283N mutant of AChE at pH 7. For the predictions on the left-hand side (a), residues E202 and H447 were modeled as singly and doubly protonated, respectively, while for the predictions on the right-hand side (b), E202 and H447 were modeled as unprotonated and singly protonated (at Nε), respectively.
Figure 4
Figure 4
(a) Correlation between experimental ln(kcat /Km) for superoxide and electrostatic potential differences for SOD from different organisms or under different conditions, and (b) experimental and calculated pH dependence of the rate constant for association of superoxide with bovine SOD. (a) The reference point (0,0) marked by a cross is for bovine SOD at pH 7.7 and 20 mM ionic strength with corresponding experimental rate constant of 3.8 109M-1s-1 [26]. The other 2 crosses are for human and Photobacterium leiognathi SODs with experimental rate constants of 2.5 and 8.5 109M-1s-1, respectively, at pH7 and 20 mM ionic strength [55]. Open circles : bovine SOD at pH 7.7 under ionic strength values of 20, 40, 90, 160 and 250 mM [26]. Connected filled circles: bovine SOD at 20 mM ionic strength and pH values ranging from 7.7 to 12.3 [26]. All points can be approximated by a linear relation y = 0.45*x (R-coefficient 0.97). The ionic strength dependence alone can be fit with y = 0.3*x (R-coefficient 0.99). On panel (b), experimental rates [26] are shown as filled circles. The pH dependence of the rates is calculated by assigning 2 different values of the dielectric constant of the protein interior (ε), 4 and 78, when computing residue pKa values (see Methods section). The value of 78 was used for pKa calculations for all titratable residues and was expected to give better agreement with experiment [28].
Figure 5
Figure 5
(a and b) Correlation between experimental ln(kcat/Km) and electrostatic potential differences for TPI and (c and d) prediction of kcat/Km for TPI for the substrate glyceraldehyde-3-phosphate. Correlations (a and b) are for differences in ln(kcat/Km) and electrostatic potential differences of each TPI protein pair, after excluding TPI1_GIALA and TPIS_RABIT. The straight lines correspond to the best linear fit and are given by y = 1.59*x (a) and y = 0.95*x (b). Predictions (c and d) were made for 10 TPIs based on experimental measurements for the two TPIs (from V. marinus (TPIS_VIBMA) and P. falciparum (TPIS_PLAFA), see Table 2) at the minimum and maximum points on the y = x line, respectively. These 2 cases were selected to derive the correlation factor α in equation (1). Then this factor was used to compute the kinetic parameter in the other cases – there are 2 predictions for each case and their deviation defines the error bars. Two outliers (with errors greater than 1.5 RMS deviation from y = x) are labeled, see text. Correlations and predictions for (a) and (c) were done using Modeller protein structural models, whereas SwissModel models were used for the correlations and predictions presented in (b) and (d).
Figure 6
Figure 6
Prediction of Km values for TPI for the substrate glyceraldehyde-3-phosphate. Predictions were made for 10 TPIs based on experimental values for 2 TPIs (from V. marinus (TPIS_VIBMA) and P. falciparum (TPIS_PLAFA). Two outliers (with errors greater than 1.5 RMS deviation from y = x) are labeled by TPIS_TRY*, referring to the enzymes TPIS_TRYBB and TPIS_TRYCR, see Table 2).
Figure 7
Figure 7
Correlation between experimental ln(kcat/Km) for bisphosphate and electrostatic potential differences for different aldolases (a) and prediction of kcat/Km for bisphosphate and class I aldolase (b). Correlations (a) are for differences in ln(kcat/Km) and electrostatic potential differences of each aldolase protein pair, after excluding ALF2_LAMJA and ALDOC_RAT. Predictions presented on part (b) were made for 8 aldolases based on ALDOB_RABIT and Q9U5N6_LEIME experimental parameters. Two outliers (with errors greater than 1.5 RMS deviation from y = x) are labeled, see text for discussion.
Figure 8
Figure 8
Correlation between experimental ln(Km) for bisphosphate and class I aldolase electrostatic potential differences. Correlations are for differences in ln(Km) and electrostatic potential differences for each aldolase protein pair. All possible pairs of the 10 aldolases are compared.
Figure 9
Figure 9
Correlation errors for ln(kcat/Km) for TPI for (a) different protein structural models and (b) different specifications of the MIF comparison region. (a) The relative error of predicted ln(kcat/Km) values of protein structural models generated by 3 different modeling protocols (see Methods for details) as a function of radius R of the sphere of comparison (with error defined as in expression (3) of the Theory section). Calculations were done with a skin accessible to a probe of radius δ = 2 Å. (b) Relative error in correlation of protein structural models using the ''Turbo'' protocol in Modeller with different probe radii δ in Å (see Methods). The radius of the comparison region, R, is varied from 7.5 to 30 Å and it is centered on the atom L230O. The degree of correlation is described by the relative correlation error, formula (3).
Figure 10
Figure 10
Comparison of three different protein structure modeling protocols for modeling TPIs. The RMSD of atoms of charged side chains is plotted against the RMSD of Cα atoms of equivalent residues in all pairs of TPI models. The data for three different sets of models are presented in green (SwissModel), blue (Modeller "Turbo") and red (Modeller "Automodel"), see Methods for details. The charged side chain atoms selected for RMSD calculations are Cζ, Nζ, Cγ and Cδ of the residues ARG, LYS, ASP and GLU, respectively. This plot shows clear differences between the three sets of models: the charged side chain atom RMSDs are on average 0.01, 0.1 and 1.0 Å for the SwissModel, ''Turbo'' and ''Automodel'' Modeller models, respectively, even though the Cα RMSDs differ insignificantly, being less than 1 Å in all three sets.
Figure 11
Figure 11
Identification of regions on the surface of TPI relevant for kcat/Km and Km kinetic parameters. By scanning patches and residues on the protein surface, calculating the correlation between electrostatic potential differences and the respective kinetic parameters kcat/Km (a) and Km (b) at each position, different regions on the TPI protein surface were found to give the best correlations with experimental data. Regions where variations in the electrostatic potential are best correlated with variations in kcat/Km (a) and Km (b) (see text for details). (c) ribbon presentation of the TPI monomer with important residues shown: the flexible loop is in magenta (W168-T175), the catalytic residues Glu165 and His95, as well as the conserved Lys13 important for electrostatic steering of the substrate are shown in red. The centers of the regions selected for correlating Km and kcat/Km parameters are shown by red balls, on the left – W168CZ3 and on the right – L230O. (d): electrostatic potential conservation: red: highest to blue: lowest.

Similar articles

Cited by

References

    1. Kitano H. Systems biology: Brief overview. Science. 2002;295:1662–1664. doi: 10.1126/science.1069492. - DOI - PubMed
    1. Gabdoulline RR, Kummer U, Olsen LF, Wade RC. Concerted simulations reveal how peroxidase compound III formation results in cellular oscillations. Biophys J. 2003;85:1421–1428. - PMC - PubMed
    1. Kettner C, Hicks MG. Chaos in the world of enzymes - How valid is functional characterization without methodological experimental data? In: Hicks MG and Kettner C, Logos Verlag; Berlin, editor. Experimental standard conditions of enzyme characterization, Proceedings of the 1st International Beilstein Symposium. Ruedesheim/Rhein; 2003. pp. 1–16.
    1. Garcia-Viloca M, Gao J, Karplus M, Truhlar DG. How enzymes work: Analysis by modern reaction rate theory and computer simulations. Science. 2004;303:186–195. doi: 10.1126/science.1088172. - DOI - PubMed
    1. Gabdoulline RR, Wade RC. Biomolecular diffusional association. Curr Opin Struct Biol. 2002;12:204–213. doi: 10.1016/S0959-440X(02)00311-1. - DOI - PubMed

Publication types

LinkOut - more resources