. 2008 Jan 15;226(2):128-39.
doi: 10.1016/j.taap.2007.08.020. Epub 2007 Aug 31.

Subhepatotoxic exposure to arsenic enhances lipopolysaccharide-induced liver injury in mice

Affiliations

Subhepatotoxic exposure to arsenic enhances lipopolysaccharide-induced liver injury in mice

Gavin E Arteel et al. Toxicol Appl Pharmacol. .

Abstract

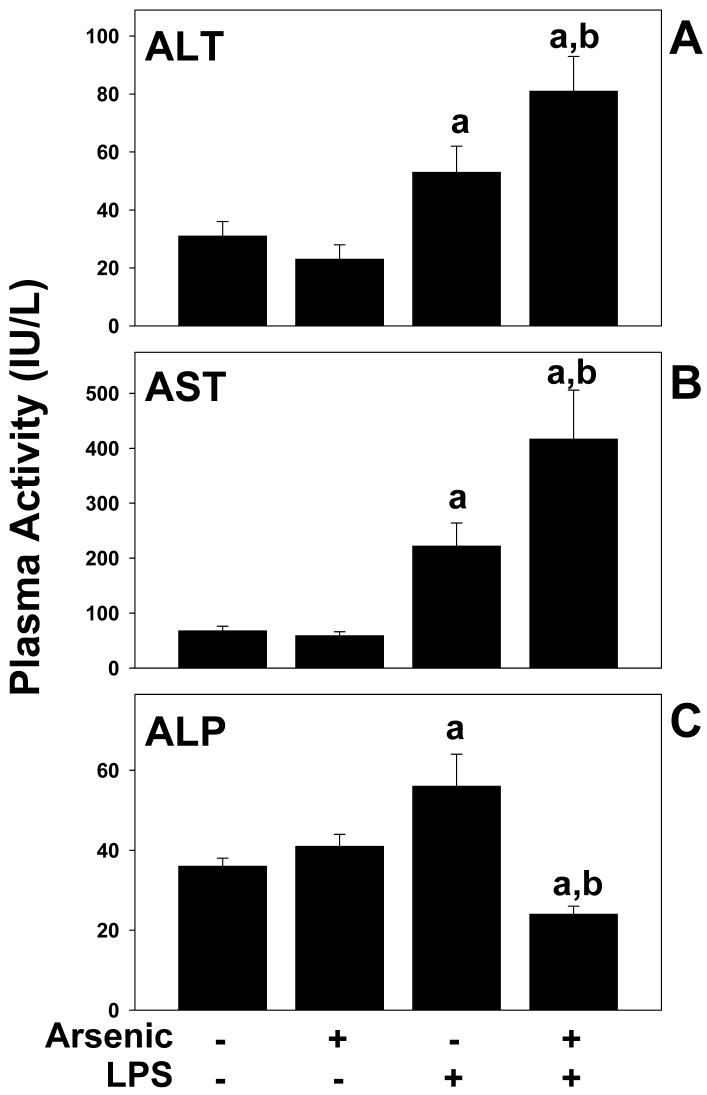
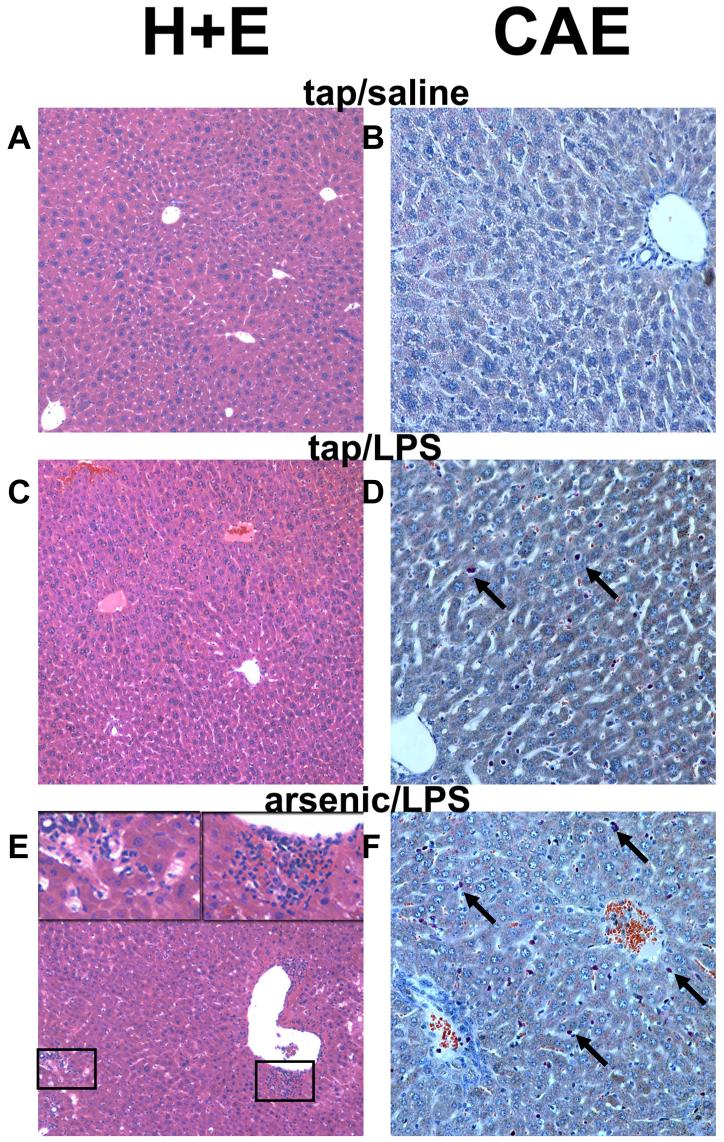
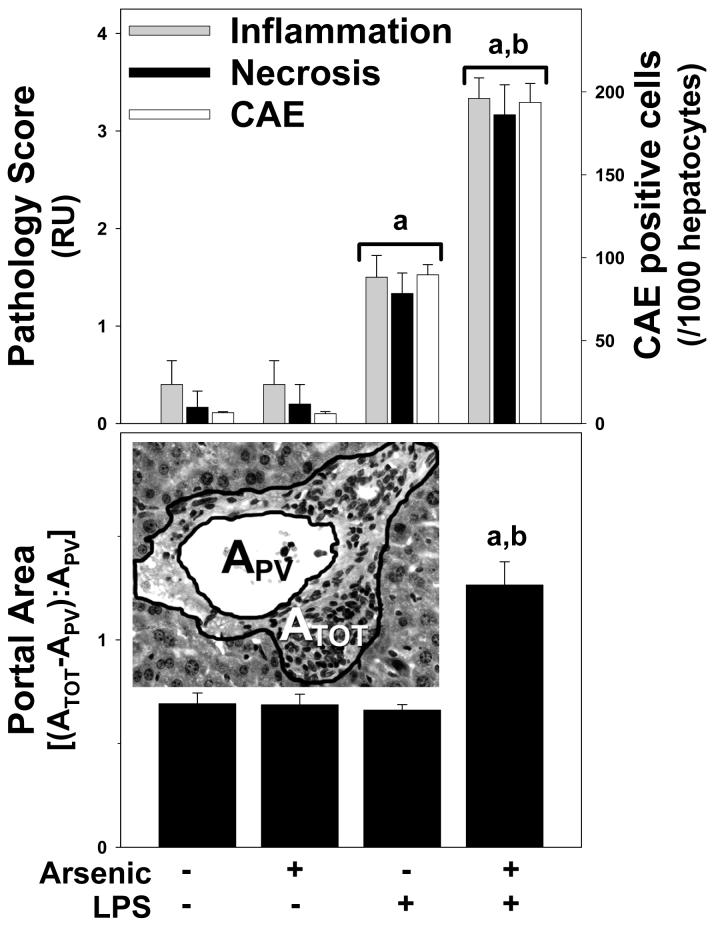
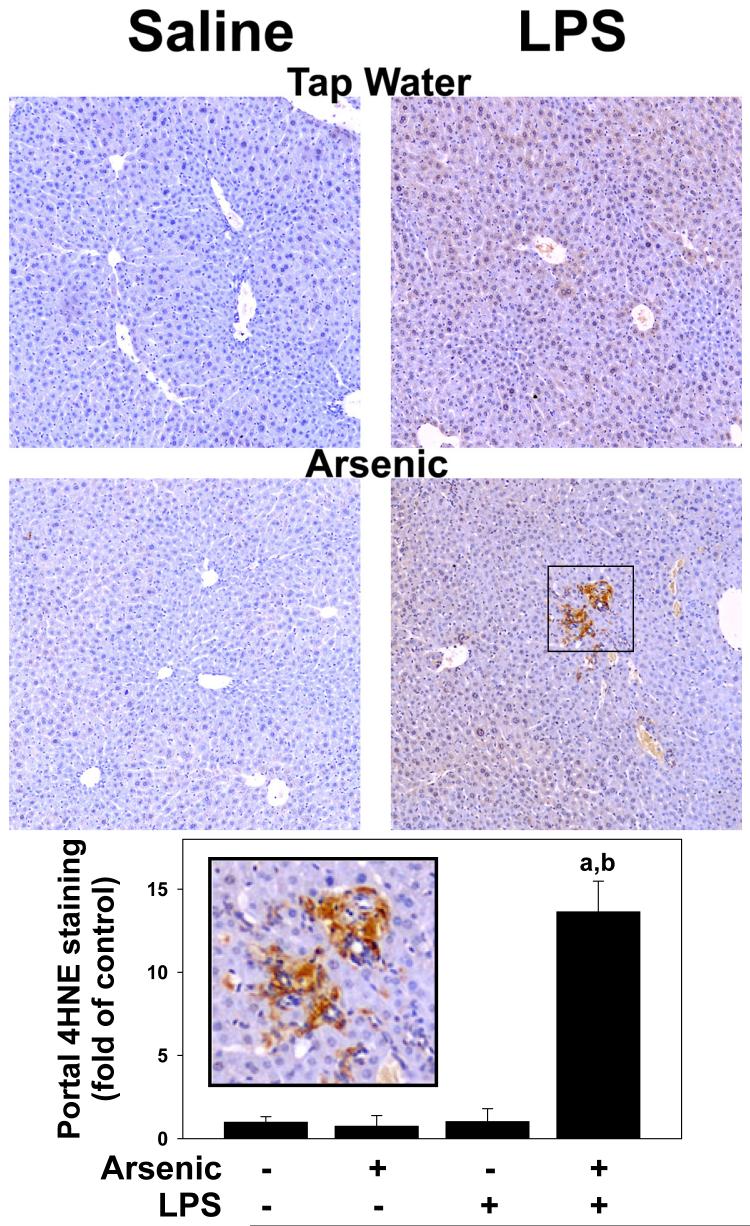
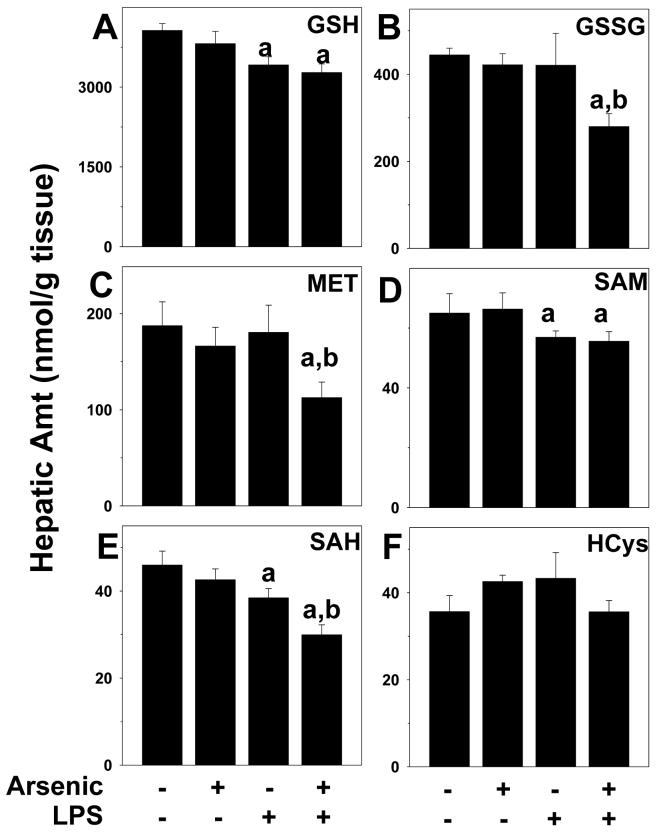
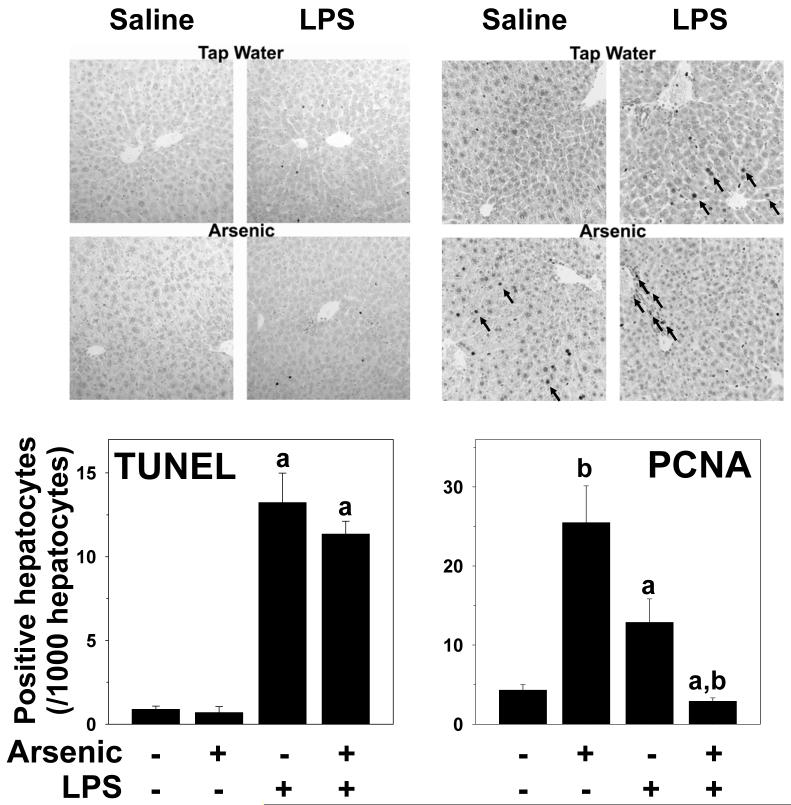
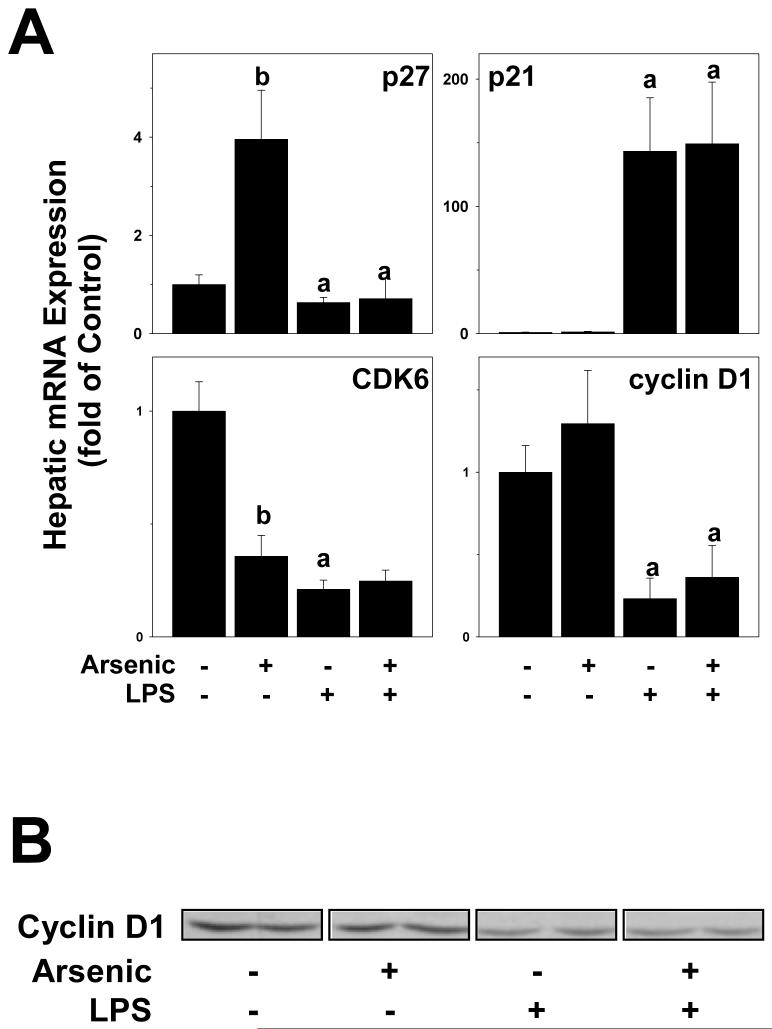
Exposure to arsenic via drinking water is a serious health concern in the US. Whereas studies have identified arsenic alone as an independent risk factor for liver disease, concentrations of arsenic required to damage this organ are generally higher than found in the US water supply. The purpose of the current study was to test the hypothesis that arsenic (at subhepatotoxic doses) may also sensitize the liver to a second hepatotoxin. To test this hypothesis, the effect of chronic exposure to arsenic on liver damage caused by acute lipopolysaccharide (LPS) was determined in mice. Male C57Bl/6J mice (4-6 weeks) were exposed to arsenic (49 ppm as sodium arsenite in drinking water). After 7 months of exposure, animals were injected with LPS (10 mg/kg i.p.) and sacrificed 24 h later. Arsenic alone caused no overt hepatotoxicity, as determined by plasma enzymes and histology. In contrast, arsenic exposure dramatically enhanced liver damage caused by LPS, increasing the number and size of necroinflammatory foci. This effect of arsenic was coupled with increases in indices of oxidative stress (4-HNE adducts, depletion of GSH and methionine pools). The number of apoptotic (TUNEL) hepatocytes was similar in the LPS and arsenic/LPS groups. In contrast, arsenic pre-exposure blunted the increase in proliferating (PCNA) hepatocytes caused by LPS; this change in the balance between cell death and proliferation was coupled with a robust loss of liver weight in the arsenic/LPS compared to the LPS alone group. The impairment of proliferation after LPS caused by arsenic was also coupled with alterations in the expression of key mediators of cell cycle progression (p27, p21, CDK6 and Cyclin D1). Taken together, these results suggest that arsenic, at doses that are not overtly hepatotoxic per se, significantly enhances LPS-induced liver injury. These results further suggest that arsenic levels in the drinking water may be a risk modifier for the development of chronic liver diseases.


Figures

Figure 1
Figure 1. Effect of arsenic and LPS on plasma parameters
Male C57BL/6J mice were exposed to arsenic or tap water and injected with LPS (or saline vehicle) as described in Methods. 24 h after LPS injection the mice were harvested and the plasma ALT, AST and ALP levels were analyzed. Data represent means ± SEM (n = 4-6). a, p < 0.05 compared to the saline injection; b, p < 0.05 compared to animals exposed to tap water.
Figure 2
Figure 2. Photomicrographs of livers following LPS injection
Representative photomicrographs of hematoxylin and eosin (H+E; 100×, left column) and chloroacetate esterase (CAE; 200×, right column) stains are shown. Arsenic exposure alone caused no detectable histologic changes compared to tap/saline controls (not shown). Insets in the lower left-hand panel depict necroinflammatory areas and portal expansion in the arsenic/LPS group. Arrows in the chloroacetate esterase-stained fields depict individual neutrophils.
Figure 3
Figure 3. Quantitation of histological changes caused by arsenic and LPS
Upper panel: Inflammation scores (grey bars), necrosis scores (black bars), and CAE positive cells (black bars) were quantitated as described in Methods. Panel B: Portal expansion was quantitated as described in Methods (see inset). The average size of the portal venules (APV) analyzed was ∼5×10⁻³ mm2 and did not significantly differ between the groups. Data represent means ± SEM (n = 4-6). a, p < 0.05 compared to the saline injection; b, p < 0.05 compared to animals exposed to tap water. Key: RU, relative units; ATOT, total area; APV, portal vessel area.
Figure 4
Figure 4. Effect of arsenic and LPS on lipid accumulation in liver
Panel A shows representative photomicrographs depicting Oil Red O staining (red; 200×) in tap/saline (upper left panel), tap/LPS (upper right panel), arsenic/saline (lower left panel) and arsenic/LPS (lower right panel) treatment groups are shown. Panel B shows quantitation of Oil Red O staining (grey bars) and triglyceride levels (black bars) in liver tissue. a, p < 0.05 compared to the saline injection; b, p < 0.05 compared to animals exposed to tap water.
Figure 5
Figure 5. Arsenic enhances oxidative stress caused by LPS
Representative photomicrographs (100×) depicted immunohistochemical detection of 4OH-nonenal adduct accumulation (brown) in liver are shown in Panel A. Summary of quantitative image-analysis of 4OH-nonenal adduct accumulation in portal regions is shown in panel B. The inset shows a blow-up of intense 4OH-noneal adduct accumulation in areas of portal expansion. Data represent means ± SEM (n = 4-6). a, p < 0.05 compared to the saline injection; b, p < 0.05 compared to animals exposed to tap water.
Figure 6
Figure 6. Effect of arsenic and LPS on indices of sulfur and methionine metabolism
Animals and treatment are as described under Methods. Hepatic levels of reduced (GSH; panel A) and oxidized (GSSG; panel B) glutathione, methionine (MET; panel C), S-adenosylmethionine (SAM; panel D), S-adenosylhomocysteine (SAH; panel E) and homocysteine (HCys; panel F) were determined by HPLC (see Methods). a, p < 0.05 compared to the saline injection; b, p < 0.05 compared to animals exposed to tap water.
Figure 7
Figure 7. Effect of arsenic and LPS on indices of hepatic apoptosis and proliferation
Immunohistochemical detection of indices of apoptosis (TUNEL; panel A) and proliferation (PCNA; panel B) were performed as described in methods. Representative photomicrographs (200×) are shown. Panels C and D show summary of quantitation of staining. a, p < 0.05 compared to the saline injection; b, p < 0.05 compared to animals exposed to tap water.
Figure 8
Figure 8. Effect of arsenic and LPS on the expression of Cyclin D1
Protein levels of cyclin D1 were determined by Western blot. Representative blots (panel A) and summary densitometric quantitation (panel B) are shown. a, p < 0.05 compared to the saline injection; b, p < 0.05 compared to animals exposed to tap water.

Similar articles

Cited by

References

    1. Arteel G, Marsano L, Mendez C, Bentley F, McClain CJ. Advances in alcoholic liver disease. Best. Pract. Res. Clin. Gastroenterol. 2003;17:625–647. - PubMed
    1. Arteel GE, Thurman RG, Yates JA, Raleigh JA. Evidence that hypoxia markers detect oxygen gradients in liver: Pimonidazole and retrograde perfusion of rat liver. Br. J. Cancer. 1995;72:889–895. - PMC - PubMed
    1. Bergheim I, Guo L, Davis MA, Lambert JC, Beier JI, Duveau I, Luyendyk JP, Roth RA, Arteel GE. Metformin prevents alcohol-induced liver injury in the mouse: Critical role of plasminogen activator inhibitor-1. Gastroenterology. 2006;130:2099–2112. - PMC - PubMed
    1. Caldon CE, Daly RJ, Sutherland RL, Musgrove EA. Cell cycle control in breast cancer cells. J. Cell Biochem. 2006;97:261–274. - PubMed
    1. Chen H, Li S, Liu J, Diwan BA, Barrett JC, Waalkes MP. Chronic inorganic arsenic exposure induces hepatic global and individual gene hypomethylation: implications for arsenic hepatocarcinogenesis. Carcinogenesis. 2004;25:1779–1786. - PubMed

Publication types

MeSH terms