. 2008 Mar-Apr;52(4-5):709-22.
doi: 10.1016/j.neuint.2007.08.020. Epub 2007 Sep 6.

Internalization and degradation of the glutamate transporter GLT-1 in response to phorbol ester

Affiliations

Internalization and degradation of the glutamate transporter GLT-1 in response to phorbol ester

Bala T S Susarla et al. Neurochem Int. 2008 Mar-Apr.

Abstract

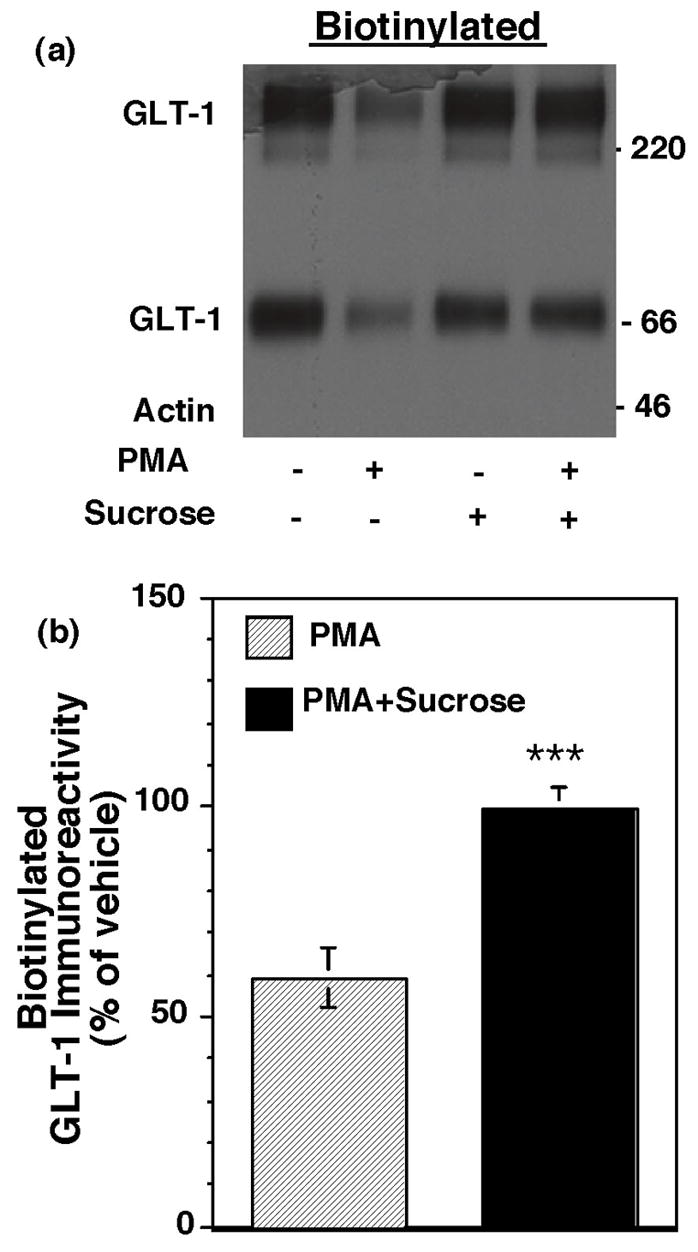
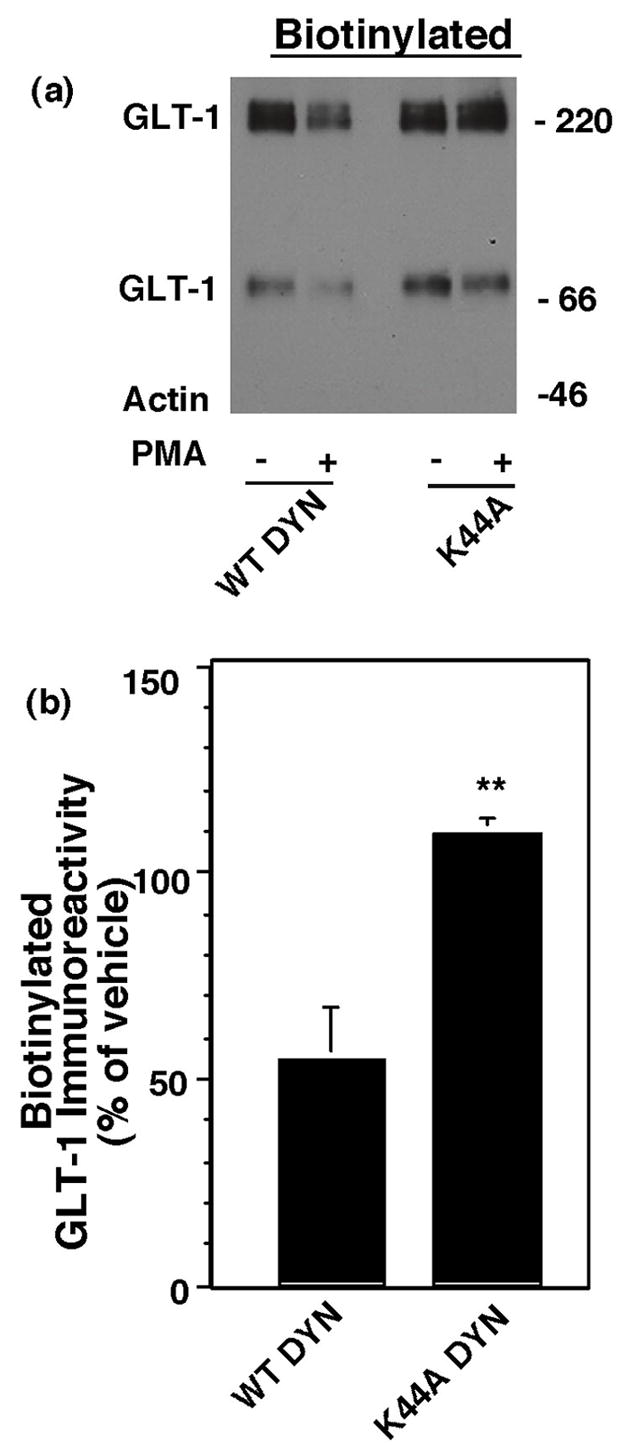
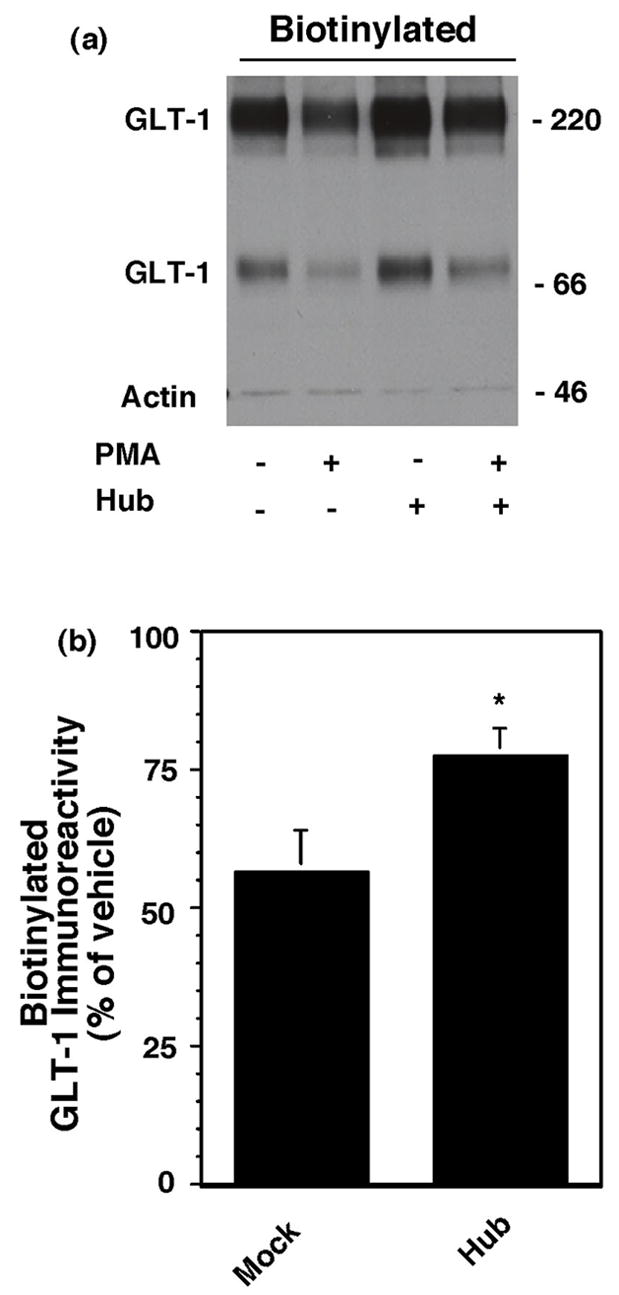
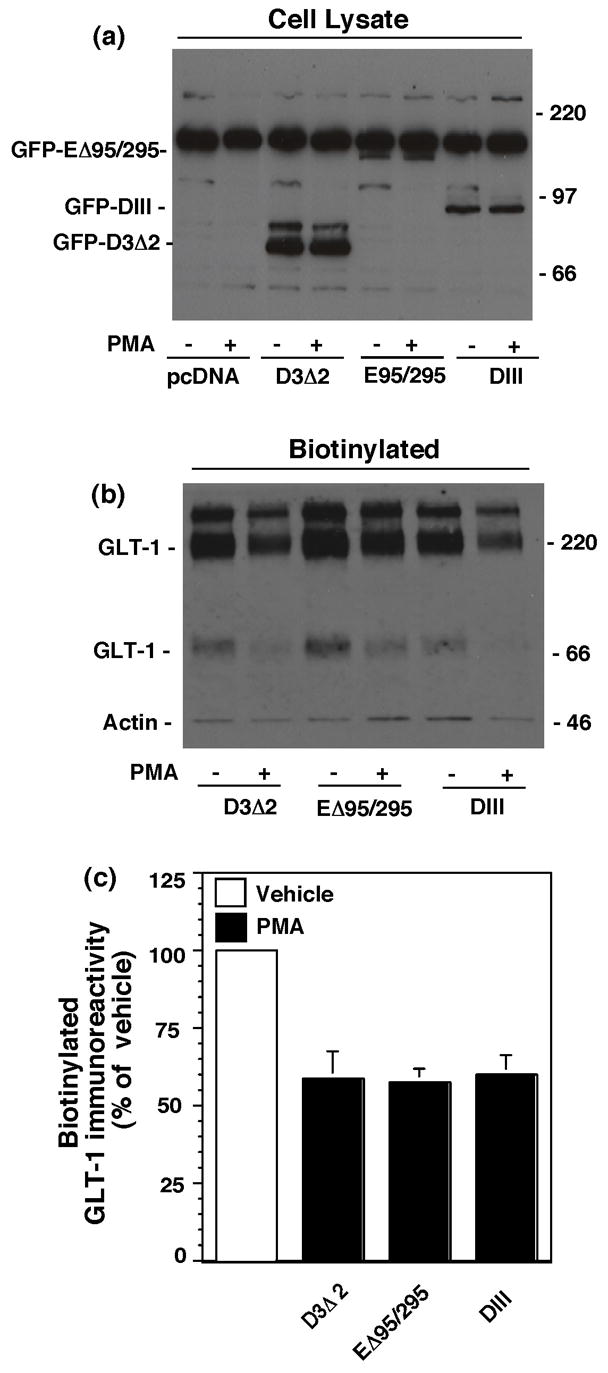
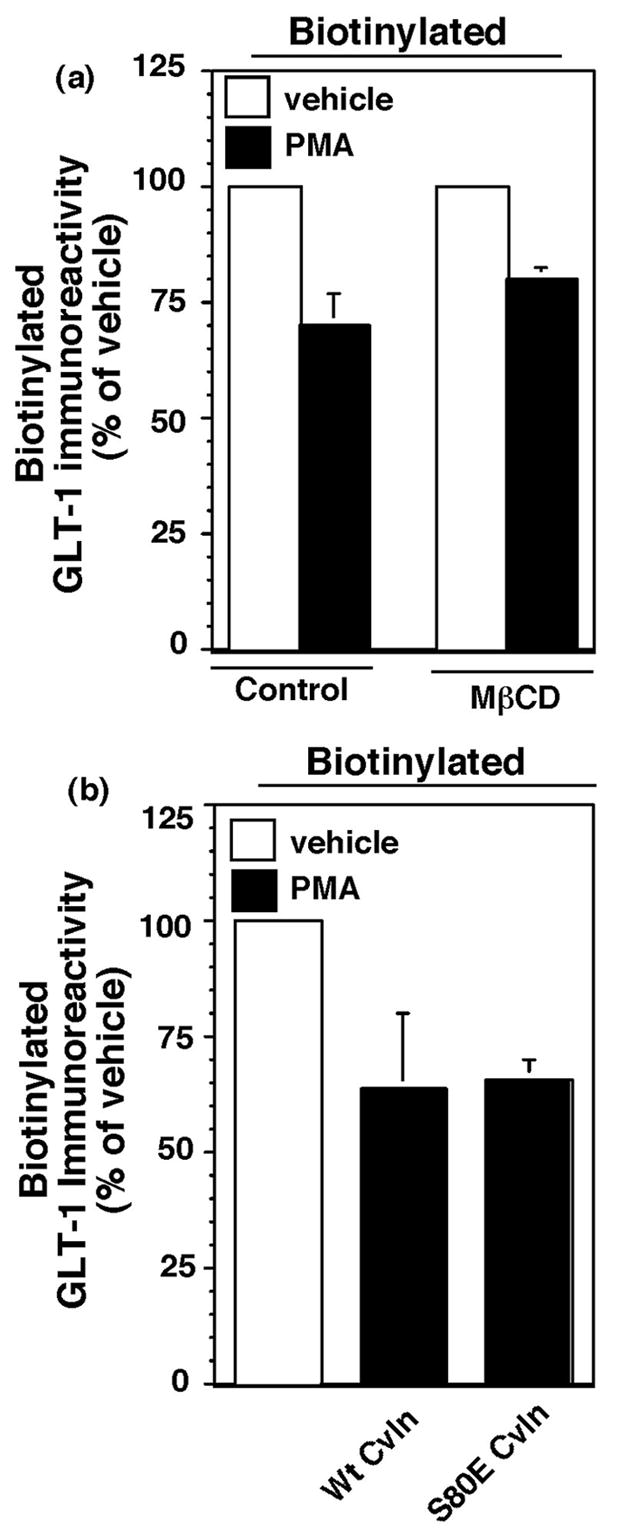
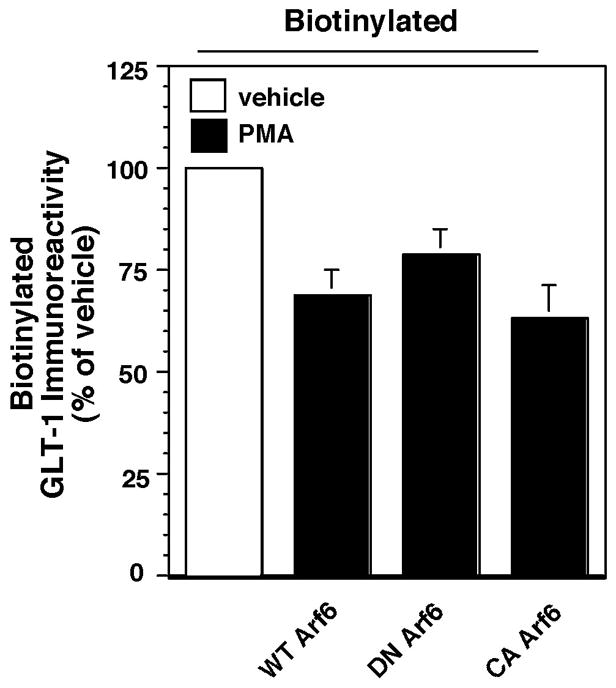
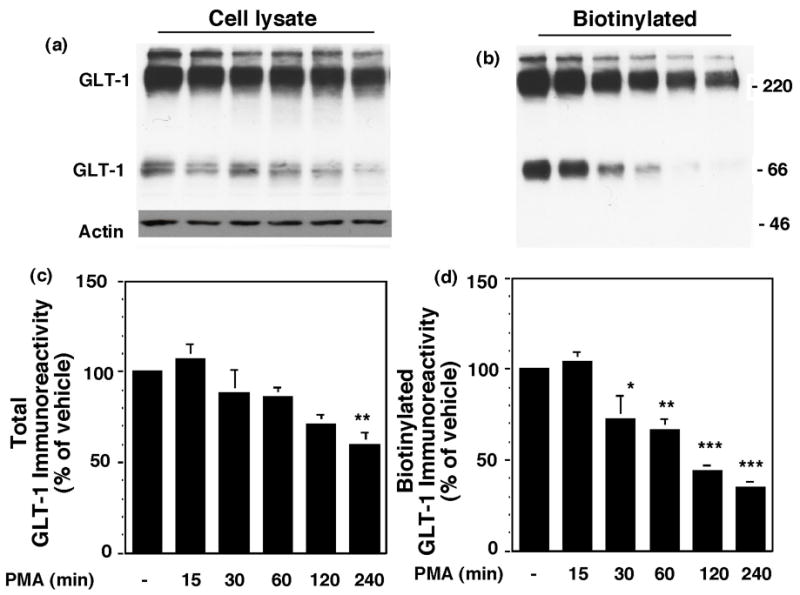
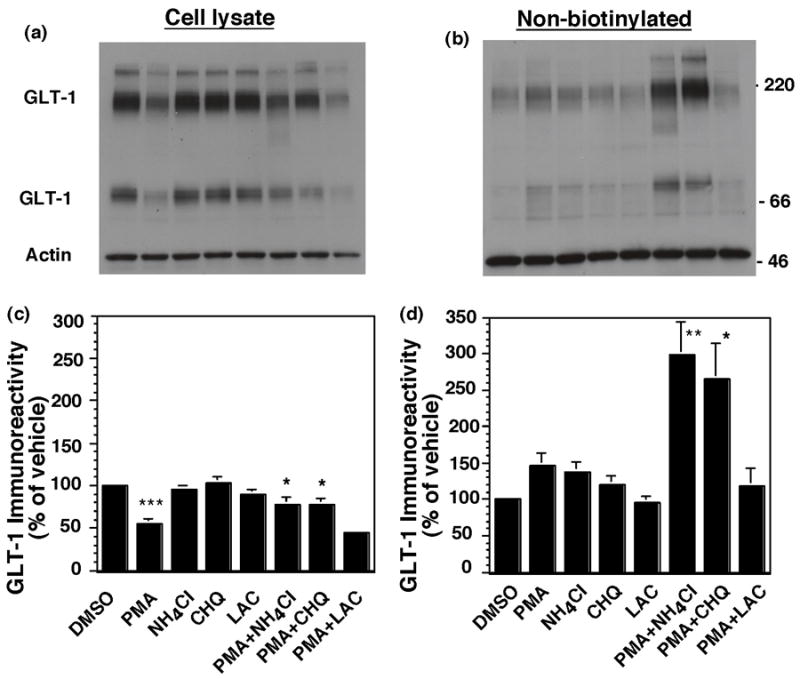
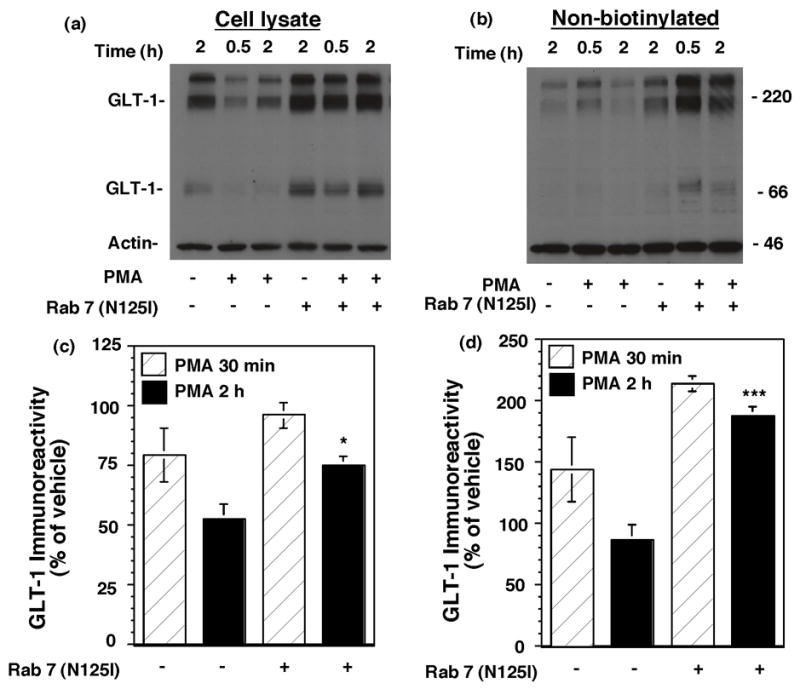
Activation of protein kinase C (PKC) decreases the activity and cell surface expression of the predominant forebrain glutamate transporter, GLT-1. In the present study, C6 glioma were used as a model system to define the mechanisms that contribute to this decrease in cell surface expression and to determine the fate of internalized transporter. As was previously observed, phorbol 12-myristate 13-acetate (PMA) caused a decrease in biotinylated GLT-1. This effect was blocked by sucrose or by co-expression with a dominant-negative variant of dynamin 1, and it was attenuated by co-expression with a dominant-negative variant of the clathrin heavy chain. Depletion of cholesterol with methyl-beta-cyclodextrin, co-expression with a dominant-negative caveolin-1 mutant (Cav1/S80E), co-expression with dominant-negative variants of Eps15 (epidermal-growth-factor receptor pathway substrate clone 15), or co-expression with dominant-negative Arf6 (T27N) had no effect on the PMA-induced loss of biotinylated GLT-1. Long-term treatment with PMA caused a time-dependent loss of biotinylated GLT-1 and decreased the levels of GLT-1 protein. Inhibitors of lysosomal degradation (chloroquine or ammonium chloride) or co-expression with a dominant-negative variant of a small GTPase implicated in trafficking to lysosomes (Rab7) prevented the PMA-induced decrease in protein and caused an intracellular accumulation of GLT-1. These results suggest that the PKC-induced redistribution of GLT-1 is dependent upon clathrin-mediated endocytosis. These studies identify a novel mechanism by which the levels of GLT-1 could be rapidly down-regulated via lysosomal degradation. The possibility that this mechanism may contribute to the loss of GLT-1 observed after acute insults to the CNS is discussed.


Figures

Fig. 1
Fig. 1
Effect of hypertonic sucrose on the PMA-induced decrease in biotinylated GLT-1. C6 cells transfected with GLT-1 cDNA were treated with hypertonic sucrose (0.45M) or vehicle for 15 min and then treated with PMA or vehicle (DMSO) for 30 min. After rapidly cooling to 4º C, cell surface proteins were biotinylated with a membrane impermeant reagent. Total protein, biotinylated proteins, and non-biotinylated proteins were analyzed by Western blot using antibodies directed against GLT-1 and actin. (a) Representative immunoblot of the biotinylated fraction; no actin was observed in the biotinylated fraction in this experiment. (b) Summary of effects of PMA in the presence and absence of sucrose on biotinylated GLT-1 (mean ± SEM of five independent experiments). The effects of PMA were expressed as a percentage of the corresponding vehicle control. In these studies, actin was essentially undetectable in the biotinylated fraction (mean = 5 ± 5% of total actin observed in the lysate fraction) and no treatment changed the amount of biotinylated actin (data not shown). There was no effect of sucrose on total GLT-1 (95 ± 8% of control) or biotinylated GLT-1 (95 ± 9 of control). ***indicates a p < 0.005 by unpaired Student’s t-test compared to the effects of PMA in the absence of sucrose.
Fig. 2
Fig. 2
Effect of dominant-negative dynamin on the PMA-induced decrease in biotinylated GLT-1. C6 cells were cotransfected with GLT-1 and wild-type (WT) dynamin or dominant-negative dynamin (K44A). After expression of the transfected cDNAs (16–20 h), cells were treated with either vehicle (DMSO) or PMA (100 nM) for 30 min and cell surface GLT-1 was measured using a membrane impermeant biotinylating reagent. (a) Representative immunoblot of biotinylated GLT-1 with no actin biotinylated. (b) Summary of effects of PMA on biotinylated GLT-1 (mean ± SEM of five independent experiments). Data for the effects of PMA were expressed as a percentage of the corresponding control (no PMA). No biotinylated actin was detected in any of these experiments and no treatments increased the amount of biotinylated actin. The percentage of biotinylated GLT-1 was not significantly different in cells co-transfected with K44A compared to WT dynamin (99 ± 1% of wild type, mean ± SEM, n =3). Data were compared by unpaired Student’s t-test. ** indicates a p <0.02 compared to cells co-transfected with wild type dynamin.
Fig. 3
Fig. 3
Effect of dominant-negative clathrin heavy chain (hub) on the PMA-induced decrease in biotinylated GLT-1. C6 cells were co-transfected with cGLT-1 and either pcDNA or T7 epitope tagged dominant negative clathrin heavy chain (Hub) construct. After being maintained overnight, cells were treated with vehicle (DMSO) or PMA for 30 min and biotinylated proteins were batch extracted using a membrane impermeant biotinylating reagent. (a) Representative western blot of GLT-1 immunoreactivity in the biotinylated fraction (note no actin was observed in this experiment). (b) Summary of effects of PMA on biotinylated GLT-1 in pcDNA transfected cells and hub transfected cells (mean ± SEM of six independent experiments). The percentage of actin detected in these experiments was 4 ± 3% of total (mean ± SEM), and it did not change under any of the conditions. Expression of total GLT-1 in cells co-transfected with hub was 114 ± 12% of that observed in cells co-transfected pcDNA. The percentage of biotinylated GLT-1 was not significantly different in cells co-transfected with hub (81 ± 5%) compared to cells co-transfected with pcDNA (76 ± 6%). * indicates a p<0.05 compared to the effects of PMA in cells co-transfected with pcDNA by unpaired Student’s t-test.
Fig. 4
Fig. 4
Effects of two different dominant-negative variants of Eps15 on the PMA-induced decrease in biotinylated GLT-1. C6 cells were co-transfected with cGLT-1 and one of the GFP tagged Eps15 constructs (D3Δ2, EΔ95/295 or DIII). After 16–20h, cells were treated with vehicle (DMSO) or PMA for 30 min and biotinylated proteins were batch extracted. (a) Representative western blot of lysates from cells transfected with GFP tagged Eps15 constructs to demonstrate expression of the Eps15 variants in C6 glioma using an anti-GFP antibody. (b) Representative western blot of biotinylated GLT-1 (note the faint band for actin immunoreactivity). (c) Summary of the effects of PMA on biotinylated GLT-1 in cells co-transfected with dominant-negative (EΔ95/295 or DIII) or control (D3Δ2) variants of Eps15 (mean ± SEM of six independent observations). In these studies, the percentage of actin biotinylated was 2 ± 1% under control conditions and did not change with any treatment. Expression of total GLT-1 in cells co-transfected with either of the dominant-negative variants of Eps15 was not different from that observed in C6 cells co-transfected with the control construct, D3Δ2 (EΔ95/295, 108 ± 12%; DIII, 89 ± 14%, expressed as a percentage of that observed in cells co-transfected with D3Δ2). The percentage of transporter biotinylated was also not affected by these constructs (EΔ95/295, 95 ± 3%; DIII, 98 ± 5%, expressed as a percentage of that observed in cells co-transfected with D3Δ2). There were no significant differences between groups as compared by ANOVA with Bonferroni post hoc correction.
Fig. 5
Fig. 5
Effect of cholesterol depletion or co-expression with a dominant-negative variant of caveolin on the PMA-induced reduction in biotinylated GLT-1. (a) C6 cells were transfected with cGLT-1. After 16–20h, they were pretreated with MΔCD (10 mM) for 5 min and then treated with vehicle (DMSO) or PMA for 30 min. In these studies, no actin was detected in western blots of the biotinylated fractions. MßCD had no significant effect on total GLT-1 expression (86 ± 20 % of vehicle treated controls) nor on the percentage of biotinylated GLT-1 (79 ± 16 % of vehicle treated controls). MΔCD had no effect on the PMA-induced decrease in biotinylated GLT-1. Data are the mean ± SEM of three independent observations. (b) C6 cells were co-transfected with GLT-1 and either wild-type or the S80E mutant variant of caveolin. After 16–20h, cells were treated with vehicle or PMA (100 nM) for 30 min and then subjected to biotinylation and western blot analyses. Summary of the results from four independent experiments are presented. Data are expressed as the % of biotinylated transporter observed after treatment with PMA compared to the corresponding vehicle treated control. In these studies, biotinylated actin was 4 ± 2% of total actin, and it did not change with treatment. Co-expression with the S80E mutant of caveolin did not change the levels of GLT-1 expression observed in cell lysates (102 ± 14 %, expression of GLT-1 as a percentage of GLT-1 immunoreactivity in cells transfected with wild-type caveolin). There was no significant effect of the S80E mutant on the PMA-induced internalization of GLT-1.
Fig. 6
Fig. 6
Effects of co-expression of variants of Arf6 on the PMA-induced redistribution of GLT-1. C6 cells were co-transfected with GLT-1 and wild-type, dominant-negative (DN) (T27N) or constitutively active (CA) (Q67L) variants of Arf6. After 16–20 h and treatment with PMA (100 nM) for 30 min, the levels of GLT-1 protein in the biotinylated fraction, in the non-biotinylated fraction, and in the total cell lysate were examined by western blot. In these studies, no actin was detected in the biotinylated fraction in any of the experiments and the levels of total GLT-1 protein were not significantly changed by either variant of Arf6 (DN Arf6, 103 ± 8 %; CA Arf6, 74 ± 28%, expressed as a % of that observed in cells co-transfected with wild-type Arf6). The proportion of GLT-1 on the plasma membrane was not significantly affected by either variant of Arf6 (DN Arf6, 103 ± 3 %; CA Arf6, 91 ± 4%; expressed as a % of that observed in cells co-transfected with wild-type Arf6). The data presented represent the summary of effects of PMA on biotinylated GLT-1 and is expressed as a percentage of the amount of immunoreactivity observed in cells transfected with the same cDNAs and treated with vehicle. Data are the mean ± SEM of five observations. There were no significant effect of either variant of Arf6 on the PMA-induced redistribution of GLT-1 (assessed by ANOVA).
Fig. 7
Fig. 7
Effects of prolonged treatment with PMA on total and biotinylated GLT-1 immunoreactivity. C6 cells were transfected with GLT-1. After 16–20 h, they were treated with PMA or vehicle for 0–4 h before measuring cell surface proteins by biotinylation. Representative immunoblots of GLT-1 and actin immunoreactivity in total cell lysate (a) and biotinylated fractions (b). Summary of data from four independent experiments (mean ± SEM) are presented in (c) and (d). Since there was no change in GLT-1 immunoreactivity in any of the three fractions in vehicle treated cells (data not shown), data are presented as the percentage of immunoreactivity observed in un-treated cells (4 h time point). In these studies, no actin was detected in the biotinylated fractions. Data were compared by ANOVA using a Bonferroni post hoc correction. *p < 0.05, **p < 0.01, ***p < 0.001 compared to DMSO at 4 h time point.
Fig. 8
Fig. 8
Effects of lysosomal or proteosomal inhibitors on the PMA-induced decrease in GLT-1 immunoreactivity. C6 glioma were transfected with GLT-1 (12 μg). After 16–20 h, cells were pretreated with NH4Cl (10 mM), chloroquine (CHQ, 50 μM) or lactacystin (LAC, 5 μM). After 15 min, cells were treated with PMA (100 nM) for 2 h and biotinylated GLT-1 was batch extracted. Representative immunoblots of cell lysate (a) and non-biotinylated fractions (b) are presented. Summary of effects on total GLT-1 immunoreactivity (c) or non-biotinylated (intracellular) GLT-1 immunoreactivity (d). Data are mean ± SEM of six independent experiments and are expressed as a percentage of that observed in cells treated with vehicle (DMSO). Data were compared by ANOVA using a Bonferroni post hoc correction. *p < 0.05, **p < 0.01 compared to cells treated with PMA.
Fig. 9
Fig. 9
Effects of co-expression of a dominant-negative variant of rab7 on the PMA-induced loss of GLT-1 immunoreactivity. C6 cells were co-transfected with GLT-1 and empty vector or dominant negative rab7 (N125I). After 16–20h, cells were treated with either vehicle or PMA (100 nM) for 30 min or 2 h. GLT-1 immunoreactivity was measured after biotinylation. Representative immunoblots from cell lysate (a) and non-biotinylated (intracellular) fractions (b) are presented. (c) & (d) are the summary of results in cell lysate and intracellular fractions (mean ± SEM) from five independent experiments. Data were expressed as a percentage of control cells transfected with pcDNA and treated with vehicle. In these studies, the mean % of actin biotinylated was 13 ± 6%, and it was not significantly affected by any of the conditions. The dominant-negative variant of rab7 had no significant effect on the PMA-induced change in biotinylated transporter with either 30 min (pcDNA, 64 ± 11%; DN rab7, 82 ± 8%) or 2 h incubation with PMA (pcDNA, 32 ± 6%; DN rab7, 40 ± 6%); data were expressed as a percentage of the corresponding vehicle control and compared by paired t-test. *p < 0.05 and **p < 0.005 compared to cells co-transfected with pcDNA and treated with PMA for 2h; comparison was conducted by paired t-test.

Similar articles

Cited by

References

    1. Allen JA, Halverson-Tamboli RA, Rasenick MM. Lipid raft microdomains and neurotransmitter signalling. Nature Neurosci Rev. 2007;8:128–140. - PubMed
    1. Apparsundaram S, Schroeter S, Giovanetti E, Blakely RD. Acute regulation of norepinephrine transport:II. PKC-modulated surface expression of human norepinephrine transporter proteins. J Pharmacol Exp Ther. 1998;287:744–751. - PubMed
    1. Beart PM, O'Shea RD. Transporters for L-glutamate: an update on their molecular pharmacology and pathological involvement. Br J Pharmacol. 2007;150:5–17. - PMC - PubMed
    1. Beckman ML, Quick MW. The ups and downs of neurotransmitter transporters. Neuroscientist. 2000;6:199–207.
    1. Benmerah A, Bayrou M, Cerf-Bensussan N, Dautry-Varsat A. Inhibition of clathrin-coated pit assembly by an Eps15 mutant. Journal of Cell Science. 1999;112:1303–1311. - PubMed

Publication types

MeSH terms