

The suprachiasmatic nucleus functions beyond circadian rhythm generation
- PMID: 17920204
- PMCID: PMC2759975
- DOI: 10.1016/j.neuroscience.2007.03.058
The suprachiasmatic nucleus functions beyond circadian rhythm generation
Abstract
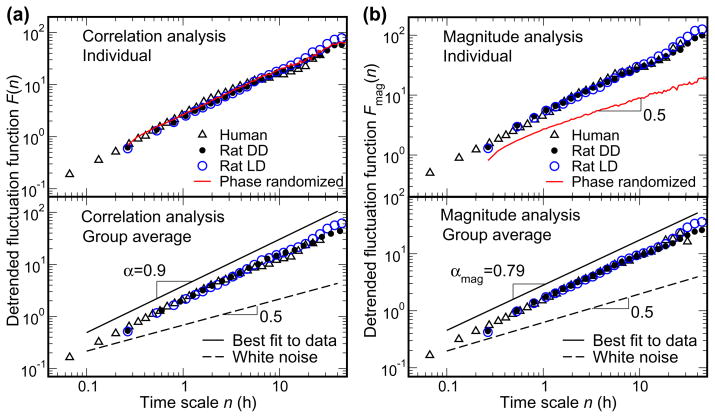
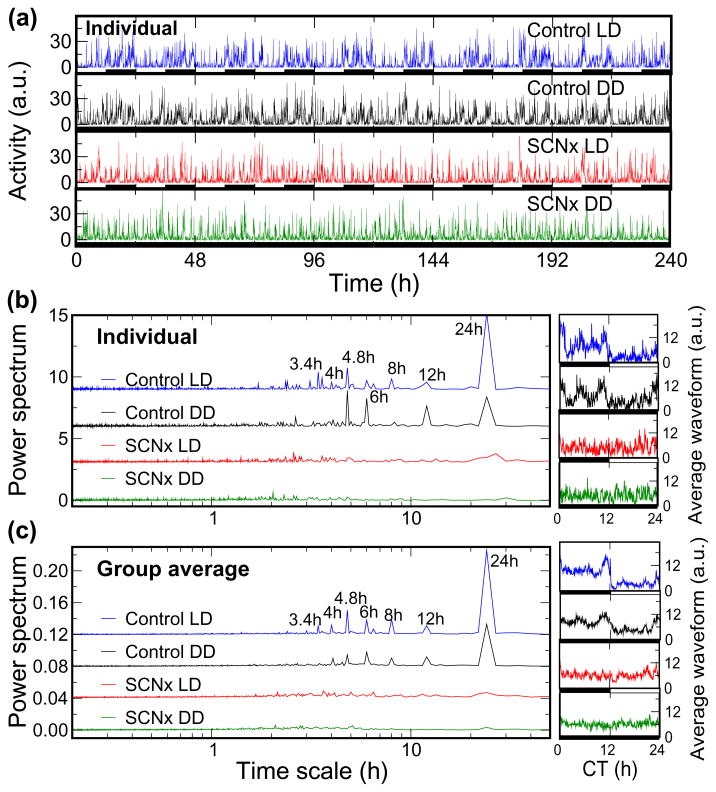
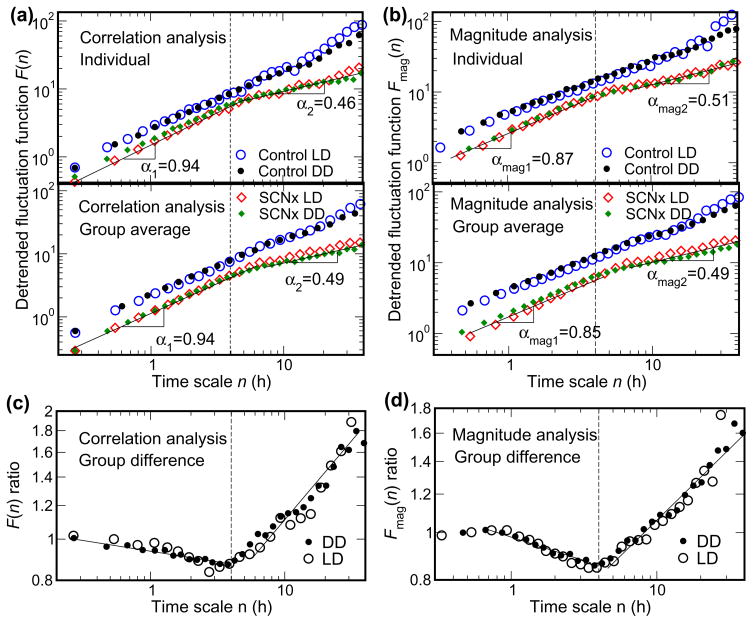
We recently discovered that human activity possesses a complex temporal organization characterized by scale-invariant/self-similar fluctuations from seconds to approximately 4 h-(statistical properties of fluctuations remain the same at different time scales). Here, we show that scale-invariant activity patterns are essentially identical in humans and rats, and exist for up to approximately 24 h: six-times longer than previously reported. Theoretically, such scale-invariant patterns can be produced by a neural network of interacting control nodes-system components with feedback loops-operating at different time scales. However such control nodes have not yet been identified in any neurophysiological model of scale invariance/self-similarity in mammals. Here we demonstrate that the endogenous circadian pacemaker (suprachiasmatic nucleus; SCN), known to modulate locomotor activity with a periodicity of approximately 24 h, also acts as a major neural control node responsible for the generation of scale-invariant locomotor patterns over a broad range of time scales from minutes to at least 24 h (rather than solely at approximately 24 h). Remarkably, we found that SCN lesion in rats completely abolished the scale-invariant locomotor patterns between 4 and 24 h and significantly altered the patterns at time scales <4 h. Identification of the control nodes of a neural network responsible for scale invariance is the critical first step in understanding the neurophysiological origin of scale invariance/self-similarity.
Figures
Similar articles
-
The endogenous circadian pacemaker imparts a scale-invariant pattern of heart rate fluctuations across time scales spanning minutes to 24 hours.J Biol Rhythms. 2008 Jun;23(3):265-73. doi: 10.1177/0748730408316166. J Biol Rhythms. 2008. PMID: 18487418 Free PMC article.
-
Fractal patterns of neural activity exist within the suprachiasmatic nucleus and require extrinsic network interactions.PLoS One. 2012;7(11):e48927. doi: 10.1371/journal.pone.0048927. Epub 2012 Nov 20. PLoS One. 2012. PMID: 23185285 Free PMC article.
-
Effect of suprachiasmatic nucleus lesion on circadian dentin increment in rats.Am J Physiol Regul Integr Comp Physiol. 2001 May;280(5):R1364-70. doi: 10.1152/ajpregu.2001.280.5.R1364. Am J Physiol Regul Integr Comp Physiol. 2001. PMID: 11294755
-
Output signals of the SCN.Chronobiol Int. 1998 Sep;15(5):535-50. doi: 10.3109/07420529808998706. Chronobiol Int. 1998. PMID: 9787940 Review.
-
Melatonin, the pineal gland, and circadian rhythms.J Biol Rhythms. 1993;8 Suppl:S73-81. J Biol Rhythms. 1993. PMID: 8274765 Review.
Cited by
-
Neurobiological studies of fatigue.Prog Neurobiol. 2012 Nov;99(2):93-105. doi: 10.1016/j.pneurobio.2012.07.004. Epub 2012 Jul 24. Prog Neurobiol. 2012. PMID: 22841649 Free PMC article. Review.
-
Unraveling dynamics of human physical activity patterns in chronic pain conditions.Sci Rep. 2013;3:2019. doi: 10.1038/srep02019. Sci Rep. 2013. PMID: 23779003 Free PMC article.
-
Aggressive dominance can decrease behavioral complexity on subordinates through synchronization of locomotor activities.Commun Biol. 2019 Dec 12;2:467. doi: 10.1038/s42003-019-0710-1. eCollection 2019. Commun Biol. 2019. PMID: 31872072 Free PMC article.
-
Computational Approaches and Tools as Applied to the Study of Rhythms and Chaos in Biology.Methods Mol Biol. 2022;2399:277-341. doi: 10.1007/978-1-0716-1831-8_13. Methods Mol Biol. 2022. PMID: 35604562
-
Fractal motor activity regulation and sex differences in preclinical Alzheimer's disease pathology.Alzheimers Dement (Amst). 2021 Jun 23;13(1):e12211. doi: 10.1002/dad2.12211. eCollection 2021. Alzheimers Dement (Amst). 2021. PMID: 34189248 Free PMC article.
References
-
- Ashkenazy Y, Hausdorff JM, Ivanov PCh, Stanley HE. A stochastic model of human gait dynamics. Physica A-Statistical Mechanics and Its Applications. 2002;316:662–670.
-
- Ashkenazy Y, Ivanov PC, Havlin S, Peng CK, Goldberger AL, Stanley HE. Magnitude and sign correlations in heartbeat fluctuations. Phys Rev Lett. 2001;86:1900–1903. - PubMed
-
- Bak P, Tang C, Wiesenfeld K. Self-organized criticality: An explanation of the 1/f noise. Phys Rev Lett. 1987;59:381–384. - PubMed
-
- Basu S, Foufoula-Georgiou E, Porte-Agel F. Synthetic turbulence, fractal interpolation, and large-eddy simulation. Phys Rev E Stat Nonlin Soft Matter Phys. 2004;70:026310. - PubMed
-
- Buijs RM, Kalsbeek A. Hypothalamic integration of central and peripheral clocks. Nat Rev Neurosci. 2001;2:521–526. - PubMed
Publication types
MeSH terms
Grants and funding
LinkOut - more resources
Full Text Sources
