

Bayesian spatial analysis of a national urinary schistosomiasis questionnaire to assist geographic targeting of schistosomiasis control in Tanzania, East Africa
- PMID: 17920605
- PMCID: PMC2653941
- DOI: 10.1016/j.ijpara.2007.08.001
Bayesian spatial analysis of a national urinary schistosomiasis questionnaire to assist geographic targeting of schistosomiasis control in Tanzania, East Africa
Abstract
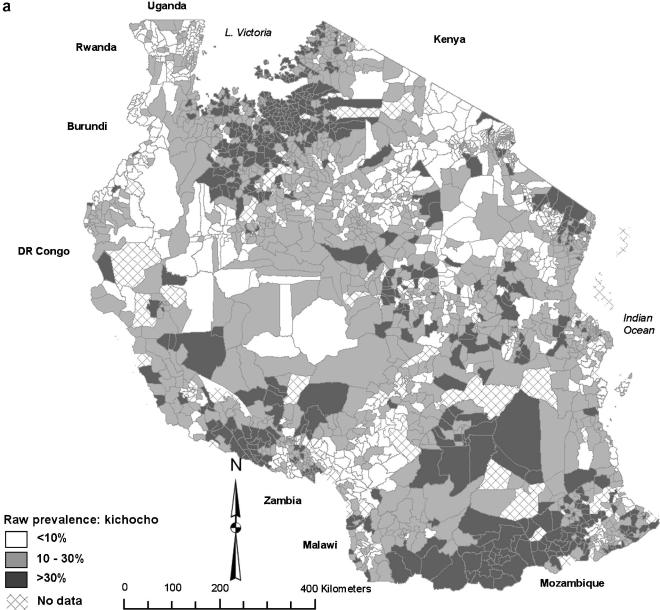
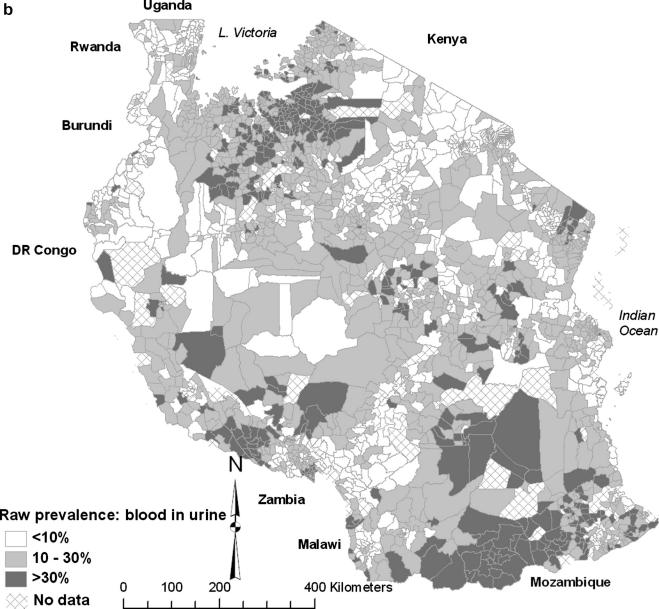
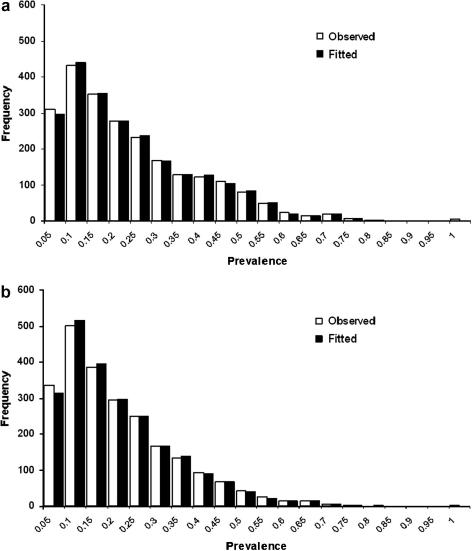
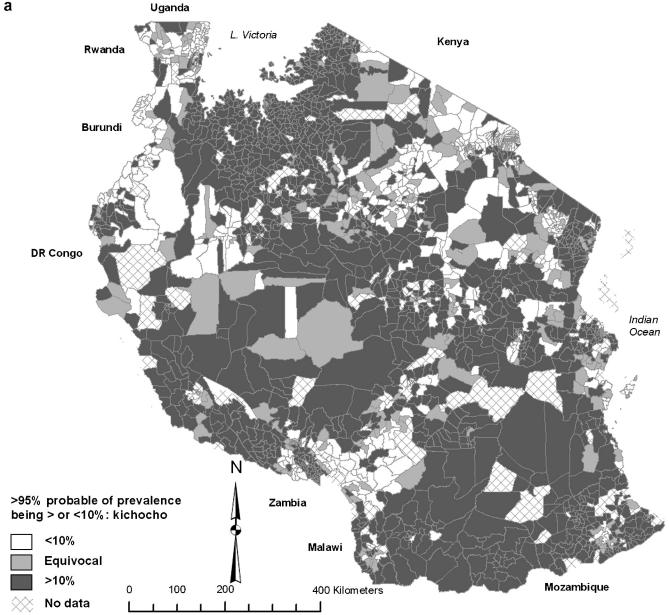
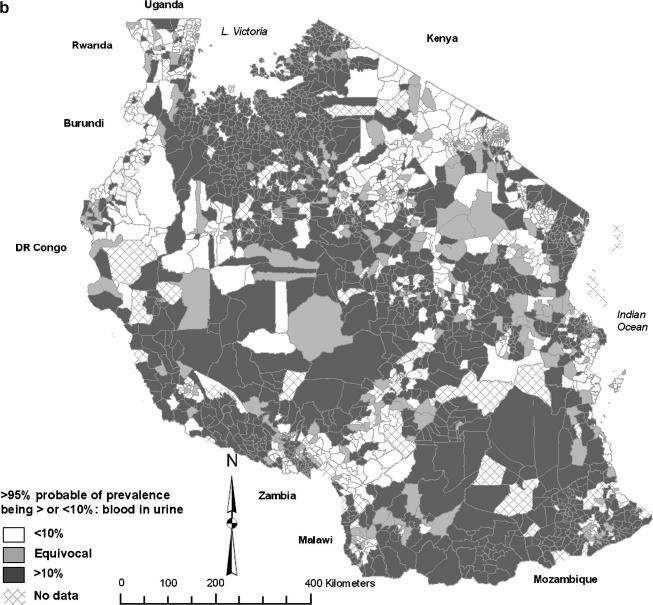
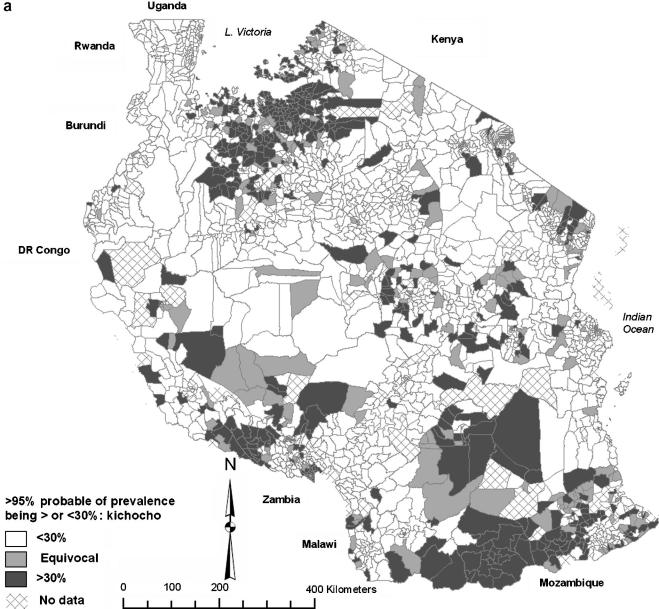
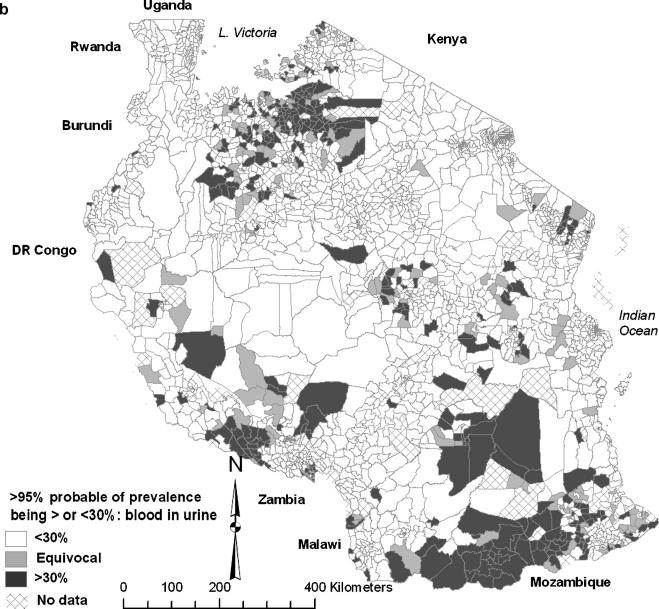
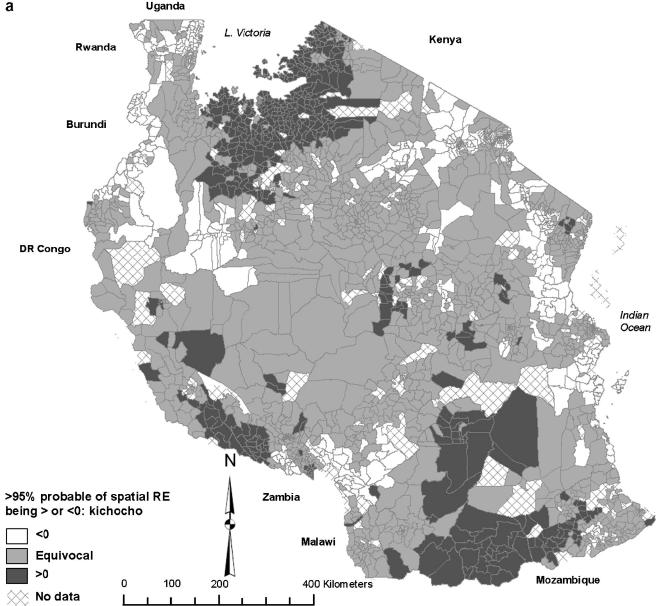
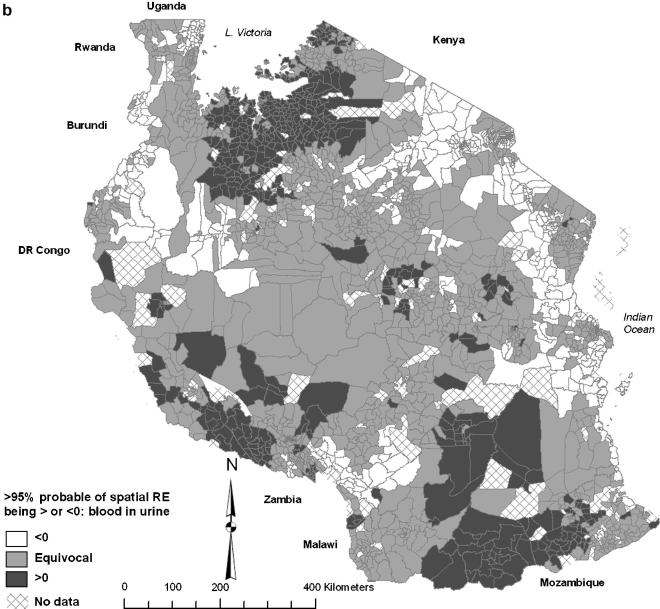
Spatial modelling was applied to self-reported schistosomiasis data from over 2.5 million school students from 12,399 schools in all regions of mainland Tanzania. The aims were to derive statistically robust prevalence estimates in small geographical units (wards), to identify spatial clusters of high and low prevalence and to quantify uncertainty surrounding prevalence estimates. The objective was to permit informed decision-making for targeting of resources by the Tanzanian national schistosomiasis control programme. Bayesian logistic regression models were constructed to investigate the risk of schistosomiasis in each ward, based on the prevalence of self-reported schistosomiasis and blood in urine. Models contained covariates representing climatic and demographic effects and random effects for spatial clustering. Degree of urbanisation, median elevation of the ward and median normalised difference vegetation index (NDVI) were significantly and negatively associated with schistosomiasis prevalence. Most regions contained wards that had >95% certainty of schistosomiasis prevalence being >10%, the selected threshold for bi-annual mass chemotherapy of school-age children. Wards with >95% certainty of schistosomiasis prevalence being >30%, the selected threshold for annual mass chemotherapy of school-age children, were clustered in north-western, south-western and south-eastern regions. Large sample sizes in most wards meant raw prevalence estimates were robust. However, when uncertainties were investigated, intervention status was equivocal in 6.7-13.0% of wards depending on the criterion used. The resulting maps are being used to plan the distribution of praziquantel to participating districts; they will be applied to prioritising control in those wards where prevalence was unequivocally above thresholds for intervention and might direct decision-makers to obtain more information in wards where intervention status was uncertain.
Figures
Similar articles
-
Bayesian spatial analysis and disease mapping: tools to enhance planning and implementation of a schistosomiasis control programme in Tanzania.Trop Med Int Health. 2006 Apr;11(4):490-503. doi: 10.1111/j.1365-3156.2006.01594.x. Trop Med Int Health. 2006. PMID: 16553932 Free PMC article.
-
Age and gender effects in self-reported urinary schistosomiasis in Tanzania.Trop Med Int Health. 2008 May;13(5):713-21. doi: 10.1111/j.1365-3156.2008.02048.x. Trop Med Int Health. 2008. PMID: 18419586
-
Prevalence and risk factors of schistosomiasis among primary school children in four selected regions of The Gambia.PLoS Negl Trop Dis. 2021 May 11;15(5):e0009380. doi: 10.1371/journal.pntd.0009380. eCollection 2021 May. PLoS Negl Trop Dis. 2021. PMID: 33974623 Free PMC article.
-
Screening for schistosomiasis with questionnaires.Trends Parasitol. 2002 Sep;18(9):375-7. doi: 10.1016/s1471-4922(02)02318-8. Trends Parasitol. 2002. PMID: 12377245 Review.
-
Application of Schistosomiasis Consortium for Operational Research and Evaluation Study Findings to Refine Predictive Modeling of Schistosoma mansoni and Schistosoma haematobium Control in Sub-Saharan Africa.Am J Trop Med Hyg. 2020 Jul;103(1_Suppl):97-104. doi: 10.4269/ajtmh.19-0852. Am J Trop Med Hyg. 2020. PMID: 32400357 Free PMC article. Review.
Cited by
-
Finding hotspots: development of an adaptive spatial sampling approach.Sci Rep. 2020 Jul 2;10(1):10939. doi: 10.1038/s41598-020-67666-3. Sci Rep. 2020. PMID: 32616757 Free PMC article.
-
Urogenital schistosomiasis among pre-school and school aged children in four districts of north western Tanzania after 15 years of mass drug administration: Geographical prevalence, risk factors and performance of haematuria reagent strips.PLoS Negl Trop Dis. 2022 Oct 12;16(10):e0010834. doi: 10.1371/journal.pntd.0010834. eCollection 2022 Oct. PLoS Negl Trop Dis. 2022. PMID: 36223393 Free PMC article.
-
Rapid mapping of schistosomiasis and other neglected tropical diseases in the context of integrated control programmes in Africa.Parasitology. 2009 Nov;136(13):1707-18. doi: 10.1017/S0031182009005940. Epub 2009 May 19. Parasitology. 2009. PMID: 19450373 Free PMC article. Review.
-
The applications of model-based geostatistics in helminth epidemiology and control.Adv Parasitol. 2011;74:267-96. doi: 10.1016/B978-0-12-385897-9.00005-7. Adv Parasitol. 2011. PMID: 21295680 Free PMC article. Review.
-
Bayesian mapping of pulmonary tuberculosis in Antananarivo, Madagascar.BMC Infect Dis. 2010 Feb 5;10:21. doi: 10.1186/1471-2334-10-21. BMC Infect Dis. 2010. PMID: 20137083 Free PMC article.
References
-
- Ansell J., Guyatt H., Hall A., Kihamia C., Kivugo J., Ntimbwa P., Bundy D. The reliability of self-reported blood in urine and schistosomiasis as indicators of Schistosoma haematobium infection in school children: a study in Muheza District, Tanzania. Trop. Med. Int. Health. 1997;2:1180–1189. - PubMed
-
- Besag J., York J., Mollie A. Bayesian image restoration, with two applications in spatial statistics. Ann. Inst. Stat. Math. 1991;43:1–59.
-
- Best N., Richardson S., Thomson A. A comparison of Bayesian spatial models for disease mapping. Stat. Methods Med. Res. 2005;14:35–59. - PubMed
-
- Booth M., Mayombana C., Machibya H., Masanja H., Odermatt P., Utzinger J., Kilima P. The use of morbidity questionnaires to identify communities with high prevalences of schistosome or geohelminth infections in Tanzania. Trans. R. Soc. Trop. Med. Hyg. 1998;92:484–490. - PubMed
Publication types
MeSH terms
Grants and funding
LinkOut - more resources
Full Text Sources
