. 2008 Jan;147(1):167-76.
doi: 10.1016/j.jviromet.2007.08.025. Epub 2007 Oct 17.

Quantitative PCR technique for detecting lymphocytic choriomeningitis virus in vivo

Affiliations

Quantitative PCR technique for detecting lymphocytic choriomeningitis virus in vivo

Megan M McCausland et al. J Virol Methods. 2008 Jan.

Abstract

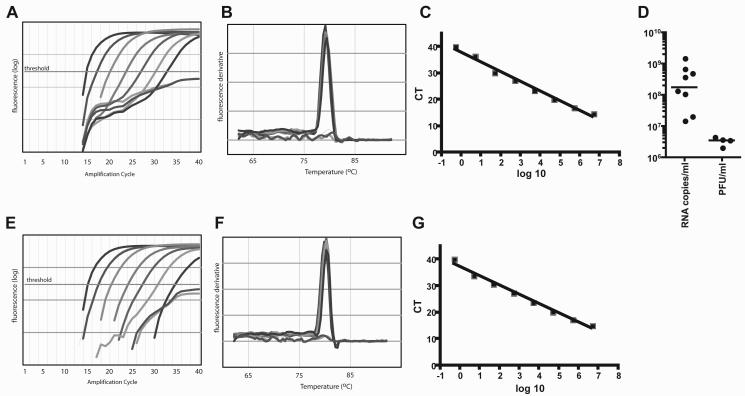
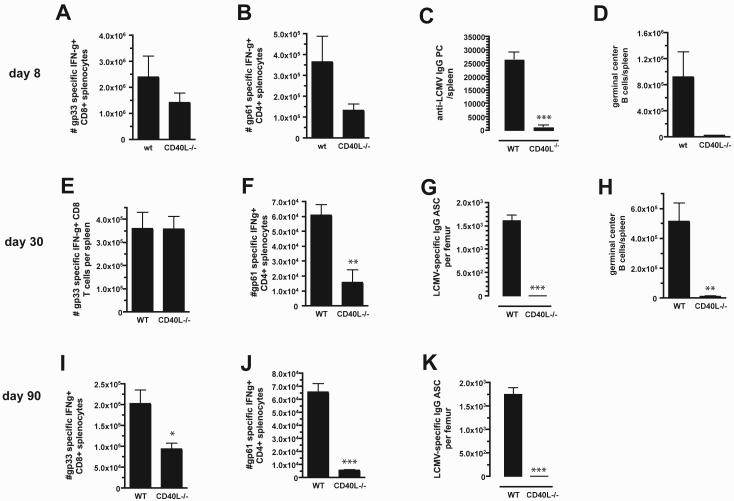
Quantitative PCR (QPCR, or real time PCR (rtPCR)) has emerged as a powerful virologic technique for measuring viral replication and viral loads in humans and animal models. We have developed a QPCR assay to accurately quantify lymphocytic choriomeningitis virus (LCMV) in infected mice. We first validated this assay using plasmid DNA and LCMV viral stocks. We then demonstrated that the LCMV QPCR assay can detect LCMV in serum and tissues of chronically infected mice (LCMV-clone 13), with greater sensitivity than conventional plaque assay. Subsequently, we demonstrated that the QPCR assay can detect LCMV in tissues of CD40L(-/-) mice during a low grade chronic infection with LCMV Armstrong. Finally, we improved the assay further such that it was approximate 1000-fold more sensitive than plaque assay for detection of the presence of LCMV in tissue.


Figures

Figure 1
Figure 1. Quantitative LCMV RT-PCR (QPCR)
(a-d) NP primers. (e-g) GP primers. (a) QPCR LCMV NP standard curve using serial dilutions of an NP encoding plasmid. Dotted line indicates threshold used to establish a positive signal. Each curve is the amplification product from an amount of plasmid template 10-fold greater than the next sample to the right. (b) Melt curves of amplified NP PCR products from the standard curve samples, demonstrating the presence of a single amplication product with the expected melting temperature. (c) Quantitation of the NP standard curve. (CT = cycle threshold) (d) QPCR of LCMVarm viral stock (LCMV RNA copies/ml), in comparison with conventional plaque assay (PFU/ml). (e) QPCR LCMV GP standard curve using serial dilutions of an GP encoding plasmid. Each curve is the amplification product from an amount of plasmid template 10-fold greater than the next sample to the right. (f) Melt curves of amplified GP PCR products from the standard curve samples, demonstrating the presence of a single amplication product with the expected melting temperature. Data is representative of more than three independent experiments. (g) Quantitation of the GP standard curve. (CT = cycle threshold).
Figure 2
Figure 2. Serum viral loads in LCMVcl13 infected mice
Comparison between QPCR (LCMV RNA copies/ml, “RNA”) and plaque assay (PFU/ml, “PFU”). Assays were run in parallel on samples divided into two aliquots. (a) Day 30 post-infection. (b) Day 60 post-infection. (c) Day 90 post-infection. Means are indicated by solid bars. Dashed lines indicate detection threshold for each assay. Data is representative of more than three independent experiments.
Figure 3
Figure 3. Serum and tissue viral loads in LCMVcl13 infected mice
Serum (a), kidney (b), and liver (c) samples were taken from a group of seven mice at day 30 after infection with LCMVcl13. QPCR (LCMV RNA copies/ml, “RNA”) and plaque assay (PFU/ml, “PFU”) were directly compared. Assays were run in parallel on samples divided into two aliquots. Means are indicated by solid bars. Dashed lines indicate detection threshold for each assay. Data is representative of more than three independent experiments.
Figure 4
Figure 4. LCMVarm viral loads in CD40L-/- mice at day 8 postinfection
Wildtype (WT) and CD40L-/- mice were infected i.p. with LCMVarm, and viral loads were measured at day 8 postinfection. QPCR (LCMV RNA copies/ml, “RNA”) and plaque assay (PFU/ml, “PFU”) were directly compared. Assays were run in parallel on samples divided into two aliquots. Means are indicated by solid bars. Dashed lines indicate detection threshold for each assay. (a) Serum. (b) spleen. (c) liver. Data is representative of two independent experiments.
Figure 5
Figure 5. LCMVarm viral loads in CD40L-/- mice at day 30 postinfection
(a) Serum. (b) Spleen. (c) Liver. (d) Kidney. Assays were run as described in Figure 4. Data is representative of two independent experiments. Dashed lines indicate detection threshold for each assay, or the threshold is below the baseline shown.
Figure 6
Figure 6. LCMVarm viral loads in CD40L-/- mice at day 90 postinfection
(a) Serum. (b) Spleen. (c) Liver. (d) Kidney. Assays were run as described in Figure 4. Dashed lines indicate detection threshold for each assay, or the threshold is below the baseline shown.
Figure 7
Figure 7. Immune responses in CD40L-/- mice
LCMV-specific CD8 T cells (a,e,i), CD4 T cells (b,f,j), plasma cells (c,g,k), and germinal centers (d,h) were quantified in the wildtype (“WT”) and CD40L-/- mice from Figures 4,5, and 6 at days 8 (a-d), 30 (e-h), and 90 (i-k) after infection with LCMVarm. N = 4/group. * = P < 0.05. ** = P < 0.01. *** = P < 0.001.
Figure 8
Figure 8. Comparison of primer pairs NP1 (original), NP2, and GP
Serum, liver, and kidney samples were tested from two representative LCMVcl13 infected mice at day 30 postinfection. (ns = nonspecific products, as determined by melt curve)
Figure 9
Figure 9. LCMVarm viral loads, using GP primers
Wildtype mice infected with LCMVarm were tested at day 8 and day 30 post-infection for LCMV using GP QPCR primers. Infected mice (“+”) were compared against uninfected mice (“—”) in all cases. (a) Serum. (b) Lymph node (inguinal). (c) Spleen. (d) Kidney. Dashed line indicates detection threshold.

References

    1. Ahmed R, Salmi A, Butler LD, Chiller JM, Oldstone MB. Selection of genetic variants of lymphocytic choriomeningitis virus in spleens of persistently infected mice. Role in suppression of cytotoxic T lymphocyte response and viral persistence. J Exp Med. 1984;160:521–40. - PMC - PubMed
    1. Bachmann MF, Hunziker L, Zinkernagel RM, Storni T, Kopf M. Maintenance of memory CTL responses by T helper cells and CD40-CD40 ligand: antibodies provide the key. Eur J Immunol. 2004;34:317–26. - PubMed
    1. Buchmeier MJ, Zajac A. Lymphocytic Choriomeningitis Virus. In: Ahmed R, Chen I, editors. Persistent Viral Infections. John Wiley and Sons; 1999. pp. 575–605.
    1. Crotty S, Kersh EN, Cannons J, Schwartzberg PL, Ahmed R. SAP is required for generating long-term humoral immunity. Nature. 2003;421:282–7. - PubMed
    1. Crotty S, McCausland MM, Aubert RD, Wherry EJ, Ahmed R. Hypogammaglobulinemia and exacerbated CD8 T-cell-mediated immunopathology in SAP-deficient mice with chronic LCMV infection mimics human XLP disease. Blood. 2006;108:3085–93. - PubMed

Publication types

MeSH terms

LinkOut - more resources