Persistent neural activity during the maintenance of spatial position in working memory
- PMID: 17920934
- PMCID: PMC2219966
- DOI: 10.1016/j.neuroimage.2007.08.040
Persistent neural activity during the maintenance of spatial position in working memory
Abstract
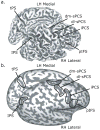
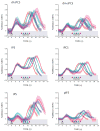
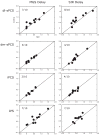
The mechanism for the short-term maintenance of information involves persistent neural activity during the retention interval, which forms a bridge between the cued memoranda and its later contingent response. Here, we used event-related functional magnetic resonance imaging to identify cortical areas with activity that persists throughout working memory delays with the goal of testing if such activity represents visuospatial attention or prospective saccade goals. We did so by comparing two spatial working memory tasks. During a memory-guided saccade (MGS) task, a location was maintained during a delay after which a saccade was generated to the remembered location. During a spatial item recognition (SIR) task identical to MGS until after the delay, a button press indicated whether a newly cued location matched the remembered location. Activity in frontal and parietal areas persisted above baseline and was greater in the hemisphere contralateral to the cued visual field. However, delay-period activity did not differ between the tasks. Notably, in the putative frontal eye field (FEF), delay period activity did not differ despite that the precise metrics of the memory-guided saccade were known during the MGS delay and saccades were never made in SIR. Persistent FEF activity may therefore represent a prioritized attentional map of space, rather than the metrics for saccades.
Figures


Similar articles
-
The frontal eye field is involved in spatial short-term memory but not in reflexive saccade inhibition.Exp Brain Res. 1999 Nov;129(2):288-301. doi: 10.1007/s002210050899. Exp Brain Res. 1999. PMID: 10591903
-
Selection and maintenance of saccade goals in the human frontal eye fields.J Neurophysiol. 2006 Jun;95(6):3923-7. doi: 10.1152/jn.01120.2005. Epub 2006 Feb 8. J Neurophysiol. 2006. PMID: 16467423 Clinical Trial.
-
Activity in human frontal cortex associated with spatial working memory and saccadic behavior.J Cogn Neurosci. 2000;12 Suppl 2:2-14. doi: 10.1162/089892900564028. J Cogn Neurosci. 2000. PMID: 11506643
-
Cortical control of ocular saccades in humans: a model for motricity.Prog Brain Res. 2003;142:3-17. doi: 10.1016/S0079-6123(03)42003-7. Prog Brain Res. 2003. PMID: 12693251 Review.
-
Does visual working memory represent the predicted locations of future target objects? An event-related brain potential study.Brain Res. 2015 Nov 11;1626:258-66. doi: 10.1016/j.brainres.2014.10.011. Epub 2014 Oct 17. Brain Res. 2015. PMID: 25445999 Review.
Cited by
-
Human Dorsolateral Prefrontal Cortex Is Not Necessary for Spatial Working Memory.J Neurosci. 2016 Mar 9;36(10):2847-56. doi: 10.1523/JNEUROSCI.3618-15.2016. J Neurosci. 2016. PMID: 26961941 Free PMC article.
-
Neural mechanisms of resource allocation in working memory.bioRxiv [Preprint]. 2024 May 12:2024.05.11.593695. doi: 10.1101/2024.05.11.593695. bioRxiv. 2024. Update in: Sci Adv. 2025 Apr 11;11(15):eadr8015. doi: 10.1126/sciadv.adr8015. PMID: 38766258 Free PMC article. Updated. Preprint.
-
Persistent Activity During Working Memory From Front to Back.Front Neural Circuits. 2021 Jul 21;15:696060. doi: 10.3389/fncir.2021.696060. eCollection 2021. Front Neural Circuits. 2021. PMID: 34366794 Free PMC article. Review.
-
Trying Harder: How Cognitive Effort Sculpts Neural Representations during Working Memory.J Neurosci. 2024 Jul 10;44(28):e0060242024. doi: 10.1523/JNEUROSCI.0060-24.2024. J Neurosci. 2024. PMID: 38769009 Free PMC article.
-
A computational model of fMRI activity in the intraparietal sulcus that supports visual working memory.Cogn Affect Behav Neurosci. 2011 Dec;11(4):573-99. doi: 10.3758/s13415-011-0054-x. Cogn Affect Behav Neurosci. 2011. PMID: 21866425
References
-
- Barash S, Bracewell RM, Fogassi L, Gnadt JW, Andersen RA. Saccade-related activity in the lateral intraparietal area. II. Spatial properties. J Neurophysiol. 1991;66:1109–1124. - PubMed
-
- Ben Hamed S, Duhamel JR, Bremmer F, Graf W. Representation of the visual field in the lateral intraparietal area of macaque monkeys: a quantitative receptive field analysis. Exp Brain Res. 2001;140:127–144. - PubMed
-
- Bisley JW, Goldberg ME. Neuronal activity in the lateral intraparietal area and spatial attention. Science. 2003;299:81–86. - PubMed
-
- Biswal BB, Hyde JS. Contour-based registration technique to differentiate between task-activated and head motion-induced signal variations in fMRI. Magn Reson Med. 1997;38:470–476. - PubMed
Publication types
MeSH terms
Grants and funding
LinkOut - more resources
Full Text Sources

