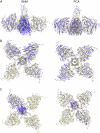
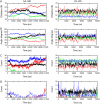
Dynamics of the acetylcholinesterase tetramer
- PMID: 17921202
- PMCID: PMC2212707
- DOI: 10.1529/biophysj.107.117879
Dynamics of the acetylcholinesterase tetramer
Abstract
Acetylcholinesterase rapidly hydrolyzes the neurotransmitter acetylcholine in cholinergic synapses, including the neuromuscular junction. The tetramer is the most important functional form of the enzyme. Two low-resolution crystal structures have been solved. One is compact with two of its four peripheral anionic sites (PAS) sterically blocked by complementary subunits. The other is a loose tetramer with all four subunits accessible to solvent. These structures lacked the C-terminal amphipathic t-peptide (WAT domain) that interacts with the proline-rich attachment domain (PRAD). A complete tetramer model (AChEt) was built based on the structure of the PRAD/WAT complex and the compact tetramer. Normal mode analysis suggested that AChEt could exist in several conformations with subunits fluctuating relative to one another. Here, a multiscale simulation involving all-atom molecular dynamics and C alpha-based coarse-grained Brownian dynamics simulations was carried out to investigate the large-scale intersubunit dynamics in AChEt. We sampled the ns-mus timescale motions and found that the tetramer indeed constitutes a dynamic assembly of monomers. The intersubunit fluctuation is correlated with the occlusion of the PAS. Such motions of the subunits "gate" ligand-protein association. The gates are open more than 80% of the time on average, which suggests a small reduction in ligand-protein binding. Despite the limitations in the starting model and approximations inherent in coarse graining, these results are consistent with experiments which suggest that binding of a substrate to the PAS is only somewhat hindered by the association of the subunits.
Figures


Similar articles
-
The association of tetrameric acetylcholinesterase with ColQ tail: a block normal mode analysis.PLoS Comput Biol. 2005 Nov;1(6):e62. doi: 10.1371/journal.pcbi.0010062. Epub 2005 Nov 18. PLoS Comput Biol. 2005. PMID: 16299589 Free PMC article.
-
Enzymatic activity versus structural dynamics: the case of acetylcholinesterase tetramer.Biophys J. 2009 Aug 5;97(3):897-905. doi: 10.1016/j.bpj.2009.05.033. Biophys J. 2009. PMID: 19651048 Free PMC article.
-
A four-to-one association between peptide motifs: four C-terminal domains from cholinesterase assemble with one proline-rich attachment domain (PRAD) in the secretory pathway.EMBO J. 1998 Nov 2;17(21):6178-87. doi: 10.1093/emboj/17.21.6178. EMBO J. 1998. PMID: 9799227 Free PMC article.
-
Acetylcholinesterase: C-terminal domains, molecular forms and functional localization.J Physiol Paris. 1998 Jun-Aug;92(3-4):183-90. doi: 10.1016/s0928-4257(98)80007-7. J Physiol Paris. 1998. PMID: 9789805 Review.
-
[The fasciculin-acetylcholinesterase interaction].J Soc Biol. 1999;193(6):505-8. J Soc Biol. 1999. PMID: 10783708 Review. French.
Cited by
-
Research on the regulation of the spatial structure of acetylcholinesterase tetramer with high efficiency by AFM.Int J Nanomedicine. 2013;8:1095-102. doi: 10.2147/IJN.S41591. Epub 2013 Mar 14. Int J Nanomedicine. 2013. PMID: 23515568 Free PMC article.
-
Phenoxyethyl Piperidine/Morpholine Derivatives as PAS and CAS Inhibitors of Cholinesterases: Insights for Future Drug Design.Sci Rep. 2019 Dec 27;9(1):19855. doi: 10.1038/s41598-019-56463-2. Sci Rep. 2019. PMID: 31882733 Free PMC article.
-
Hot Spots for Protein Partnerships at the Surface of Cholinesterases and Related α/β Hydrolase Fold Proteins or Domains-A Structural Perspective.Molecules. 2017 Dec 23;23(1):35. doi: 10.3390/molecules23010035. Molecules. 2017. PMID: 29295471 Free PMC article. Review.
-
Gated Diffusion-controlled Reactions.BMC Biophys. 2011 Mar 2;4:4. doi: 10.1186/2046-1682-4-4. BMC Biophys. 2011. PMID: 21595999 Free PMC article.
-
Secondary Interaction Interfaces with PCNA Control Conformational Switching of DNA Polymerase PolB from Polymerization to Editing.J Phys Chem B. 2016 Aug 25;120(33):8379-88. doi: 10.1021/acs.jpcb.6b02082. Epub 2016 May 4. J Phys Chem B. 2016. PMID: 27109703 Free PMC article.
References
-
- Sussman, J. L., M. Harel, F. Frolow, C. Oefner, A. Goldman, L. Toker, and I. Silman. 1991. Atomic structure of acetylcholinesterase from Torpedo californica: a prototypic acetylcholine-binding protein. Science. 253:872–879. - PubMed
-
- Johnson, G., and S. W. Moore. 2006. The peripheral anionic site of acetylcholinesterase: structure, functions and potential role in rational drug design. Curr. Pharm. Des. 23:217–225. - PubMed
-
- Rieger, F., S. Bon, and J. Massoulie. 1973. Electron microscopic studies on stretched and globular acetylcholinesterase molecules of the electric eel (Electrophorus electricus). Eur. J. Biochem. 34:539–547. - PubMed
-
- Cartaud, J., F. Rieger, S. Bon, and J. Massoulie. 1975. Fine structure of electric eel acetylcholinesterase. Brain Res. 88:127–130. - PubMed
-
- Bourne, Y., P. Taylor, P. E. Bougis, and P. Marchot. 1999. Crystal structure of mouse acetylcholinesterase. A peripheral site-occluding loop in a tetrameric assembly. J. Biol. Chem. 274:2963–2970. - PubMed
Publication types
MeSH terms
Substances
Grants and funding
LinkOut - more resources
Full Text Sources
Miscellaneous

