. 2008 Feb 1;94(3):772-83.
doi: 10.1529/biophysj.107.107284. Epub 2007 Oct 5.

Exploring the parameter space of complex self-assembly through virus capsid models

Affiliations

Exploring the parameter space of complex self-assembly through virus capsid models

Blake Sweeney et al. Biophys J. .

Abstract

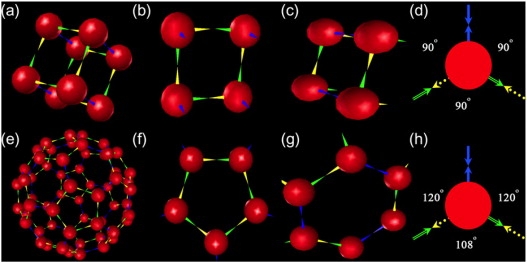
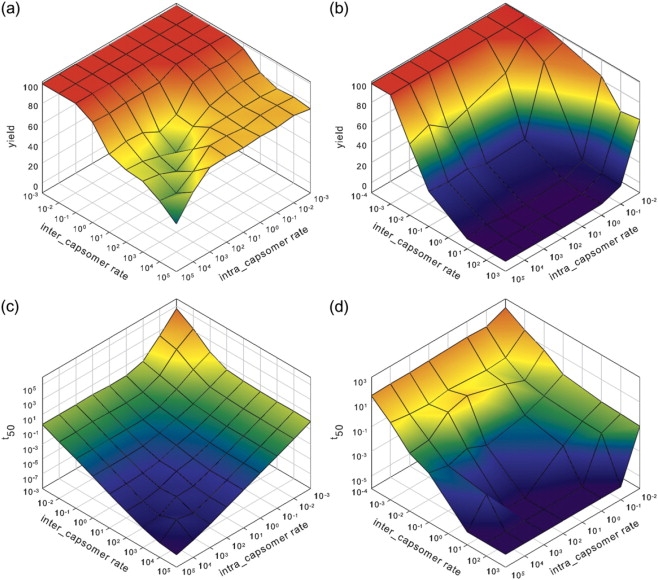
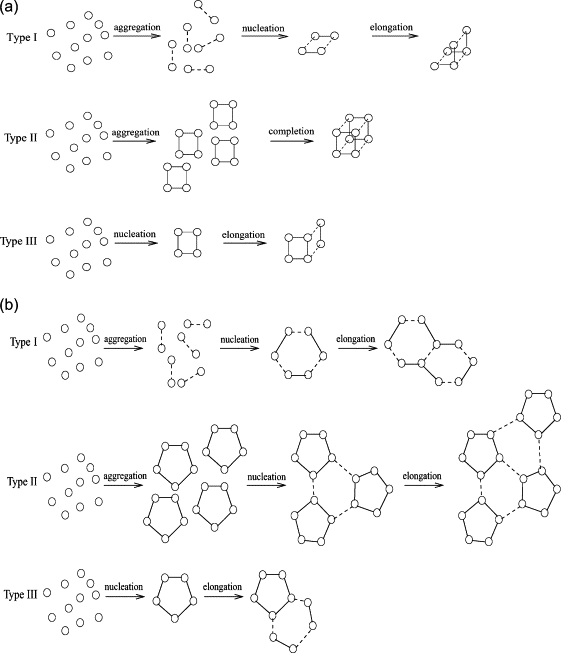
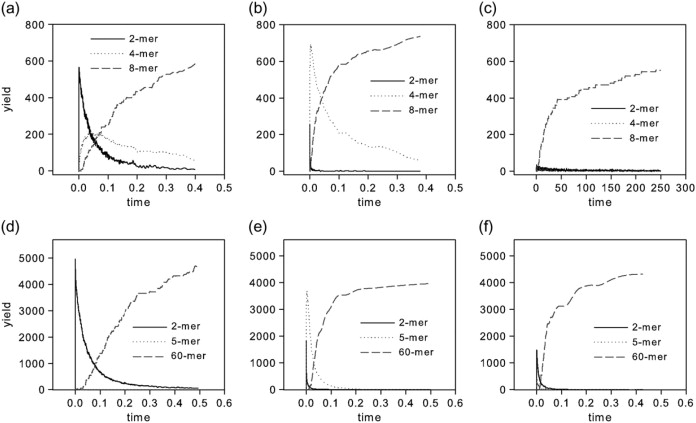
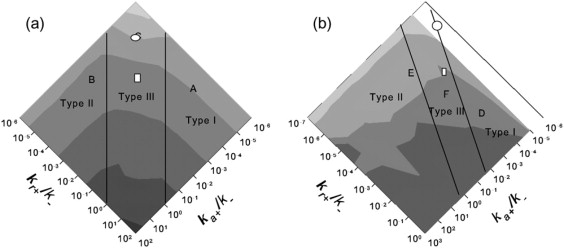
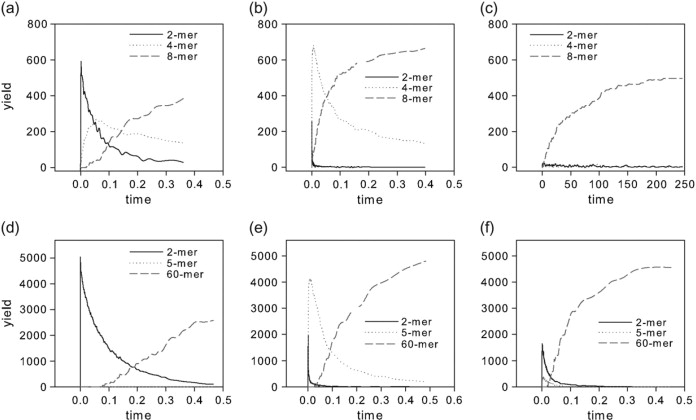
We use discrete event stochastic simulations to characterize the parameter space of a model of icosahedral viral capsid assembly as functions of monomer-monomer binding rates. The simulations reveal a parameter space characterized by three major assembly mechanisms, a standard nucleation-limited monomer-accretion pathway and two distinct hierarchical assembly pathways, as well as unproductive regions characterized by kinetically trapped species. Much of the productive parameter space also consists of border regions between these domains where hybrid pathways are likely to operate. A simpler octamer system studied for comparison reveals three analogous pathways, but is characterized by much lesser sensitivity to parameter variations in contrast to the sharp changes visible in the icosahedral model. The model suggests that modest changes in assembly conditions, consistent with expected differences between in vitro and in vivo assembly environments, could produce substantial shifts in assembly pathways. These results suggest that we must be cautious in drawing conclusions about in vivo capsid self-assembly dynamics from theoretical or in vitro models, as the nature of the basic assembly mechanisms accessible to a system can substantially differ between simple and complex model systems, between theoretical models and simulation results, and between in vitro and in vivo assembly conditions.


Figures

Figure 1
Figure 1
Model systems, key intermediates, and the local rules that produce them. The top row corresponds to the octamer system and the bottom row to the icosahedron system. (a) Complete octamer. (b) Homogeneous tetramer (capsomer) intermediate. (c) Heterogeneous tetramer intermediate. (d) Local rule describing the coat protein interactions in the octamer. The yellow and green arrows represent the asymmetric intracapsomer binding interactions and the blue arrows represent the symmetric intercapsomer interactions. (e) Complete icosahedron. (f) Pentamer (capsomer) intermediate. (g) Hexamer (trimer-of-dimers) intermediate. (h) Local rule describing the coat protein interactions in the icosahedron. The yellow and green arrows represent the asymmetric intracapsomer binding interactions and the blue arrows represent the symmetric intercapsomer interactions.
Figure 2
Figure 2
Changes of assembly yields (a and b) and assembly time needed to reach half the equilibrium level (T50) (c and d) with intracapsomer and intercapsomer binding rate constants. A fixed breaking rate constant of 1000 is used across all the simulation experiments. (a) Yield of final assembled 8-mer (cube) structures for the octamer model. (b) Yield of final assembled 60-mer structures (icosahedron) for the capsid model. (c) T50 for the octamer model. (d) T50 for the icosahedral capsid model.
Figure 3
Figure 3
Predicted pathway domains for the two model systems. Each system is predicted to have three major pathways: two distinct hierarchical pathways (types I and II) and one nonhierarchical pathway exhibiting classic nucleation-limited growth (type III). (a) Octamer pathways. (b) Icosahedron pathways.
Figure 4
Figure 4
Weighted intermediate species distributions over time for regions of interest. (a) Octamer simulation for ka+ = 10−2, kr+ = 10, belonging to the type I region. (b) Octamer simulation for ka+ = 10, kr+ = 10−2, belonging to the type II region. (c) Octamer simulation for ka+ = 10−2, kr+ = 10−2, belonging to the type III region. (d) Icosahedron simulation for ka+ = 10−2, kr+ = 10, belonging to the type I region. (e) Icosahedron simulation for ka+ = 1, kr+ = 10−2, belonging to the type II region. (f) Icosahedron simulation for ka+ = 10−1, kr+ = 10−1, belonging to the type III region.
Figure 5
Figure 5
Phase diagrams mapping the predicted regions of assembly to plots of T50. Darker intensities correspond to shorter times to assembly or to regions in which no productive assembly occurs. The slopes of the boundary lines are based on the orders of the aggregation events for the two hierarchical domains whereas the exact positions of the lines are based on visual identification of the region for which further change in the higher rate produces negligible overall increases in reaction rate. Consensus parameter values from capsid assembly estimates in the literature are marked assuming a 10-μM concentration typical for an in vitro system (circles) or assuming 500 μM concentration more likely to be representative in vivo (squares). Letters AF mark points in the parameter domain at which intermediate distributions over time are surveyed in Fig. 4. (a) Octamer system. (b) Icosahedral system.
Figure 6
Figure 6
Weighted intermediate species distributions over time for regions of interest with the simulator's diffusion rate correction option enabled. (a) Octamer simulation for ka+ = 10−2, kr+ = 10, belonging to the type I region. (b) Octamer simulation for ka+ = 10, kr+ = 10−2, belonging to the type II region. (c) Octamer simulation for ka+ = 10−2, kr+ = 10−2, belonging to the type III region. (d) Icosahedron simulation for ka+ = 10−2, kr+ = 10, belonging to the type I region. (e) Icosahedron simulation for ka+ = 1, kr+ = 10−2, belonging to the type II region. (f) Icosahedron simulation for ka+ = 10−1, kr+ = 10−1, belonging to the type III region.

Similar articles

Cited by

References

    1. Schwartz R., Shor P.W., Prevelige P.E., Berger B. Local rules simulation of the kinetics of virus capsid self-assembly. Biophys. J. 1998;75:2626–2636. - PMC - PubMed
    1. Kelly J.W. The environmental dependency of protein folding best explains prion and amyloid diseases. Proc. Natl. Acad. Sci. USA. 1998;95:930–932. - PMC - PubMed
    1. Baskakov I.V., Aagaard C., Mehlhorn I., Wille H., Groth D., Baldwin M.A., Prusiner S.B., Cohen F.E. Self-assembly of recombinant prion protein of 106 residues. Biochemistry. 2000;39:2792–2804. - PubMed
    1. Forster A.C., Church G.M. Towards synthesis of a minimal cell. Mol. Syst. Biol. 2006;2:45. - PMC - PubMed
    1. Prevelige P.E., Thomas D., King J. Nucleation and growth phases in the polymerization of coat and scaffolding subunits into icosahedral procapsid shells. Biophys. J. 1993;64:824–835. - PMC - PubMed

Substances

LinkOut - more resources