

Analysis of damped oscillations during reentry: a new approach to evaluate cardiac restitution
- PMID: 17921218
- PMCID: PMC2186252
- DOI: 10.1529/biophysj.107.113811
Analysis of damped oscillations during reentry: a new approach to evaluate cardiac restitution
Abstract
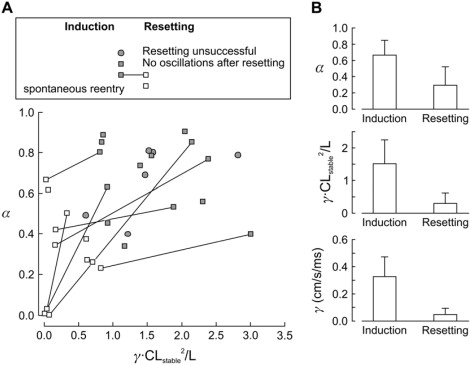
Reentry is a mechanism underlying numerous cardiac arrhythmias. During reentry, head-tail interactions of the action potential can cause cycle length (CL) oscillations and affect the stability of reentry. We developed a method based on a difference-delay equation to determine the slopes of the action potential duration and conduction velocity restitution functions, known to be major determinants of reentrant arrhythmogenesis, from the spatial period P and the decay length D of damped CL oscillations. Using this approach, we analyzed CL oscillations after the induction of reentry and the resetting of reentry with electrical stimuli in rings of cultured neonatal rat ventricular myocytes grown on microelectrode arrays and in corresponding simulations with the Luo-Rudy model. In the experiments, P was larger and D was smaller after resetting impulses compared to the induction of reentry, indicating that reentry became more stable. Both restitution slopes were smaller. Consistent with the experimental findings, resetting of simulated reentry caused oscillations with gradually increasing P, decreasing D, and decreasing restitution slopes. However, these parameters remained constant when ion concentrations were clamped, revealing that intracellular ion accumulation stabilizes reentry. Thus, the analysis of CL oscillations during reentry opens new perspectives to gain quantitative insight into action potential restitution.
Figures


Similar articles
-
Alternans resonance and propagation block during supernormal conduction in cardiac tissue with decreased [K(+)](o).Biophys J. 2010 Apr 7;98(7):1129-38. doi: 10.1016/j.bpj.2009.12.4280. Biophys J. 2010. PMID: 20371312 Free PMC article.
-
The transfer functions of cardiac tissue during stochastic pacing.Biophys J. 2009 Jan;96(1):294-311. doi: 10.1016/j.bpj.2008.09.025. Biophys J. 2009. PMID: 19134481 Free PMC article.
-
Dynamical effects of diffusive cell coupling on cardiac excitation and propagation: a simulation study.Am J Physiol Heart Circ Physiol. 2004 Dec;287(6):H2803-12. doi: 10.1152/ajpheart.00299.2004. Epub 2004 Jul 22. Am J Physiol Heart Circ Physiol. 2004. PMID: 15271669
-
Influence of anisotropic conduction properties in the propagation of the cardiac action potential.Prog Biophys Mol Biol. 2007 May-Jun;94(1-2):144-68. doi: 10.1016/j.pbiomolbio.2007.03.014. Epub 2007 Mar 24. Prog Biophys Mol Biol. 2007. PMID: 17482242 Free PMC article. Review.
-
Basic mechanisms of cardiac impulse propagation and associated arrhythmias.Physiol Rev. 2004 Apr;84(2):431-88. doi: 10.1152/physrev.00025.2003. Physiol Rev. 2004. PMID: 15044680 Review.
Cited by
-
Alternans resonance and propagation block during supernormal conduction in cardiac tissue with decreased [K(+)](o).Biophys J. 2010 Apr 7;98(7):1129-38. doi: 10.1016/j.bpj.2009.12.4280. Biophys J. 2010. PMID: 20371312 Free PMC article.
-
The transfer functions of cardiac tissue during stochastic pacing.Biophys J. 2009 Jan;96(1):294-311. doi: 10.1016/j.bpj.2008.09.025. Biophys J. 2009. PMID: 19134481 Free PMC article.
References
-
- Kléber A.G., Rudy Y. Basic mechanisms of cardiac impulse propagation and associated arrhythmias. Physiol. Rev. 2004;84:431–488. - PubMed
-
- Hund T.J., Otani N.F., Rudy Y. Dynamics of action potential head-tail interaction during reentry in cardiac tissue: ionic mechanisms. Am. J. Physiol. Heart Circ. Physiol. 2000;279:H1869–H1879. - PubMed
-
- Frame L.H., Simson M.B. Oscillations of conduction, action potential duration, and refractoriness. A mechanism for spontaneous termination of reentrant tachycardias. Circulation. 1988;78:1277–1287. - PubMed
-
- Courtemanche M., Glass L., Keener J.P. Instabilities of a propagating pulse in a ring of excitable media. Phys. Rev. Lett. 1993;70:2182–2185. - PubMed
-
- Qu Z., Weiss J.N., Garfinkel A. Cardiac electrical restitution properties and stability of reentrant spiral waves: a simulation study. Am. J. Physiol. 1999;276:H269–H283. - PubMed
Publication types
MeSH terms
LinkOut - more resources
Full Text Sources
