. 2008 Mar 1;94(5):1836-53.
doi: 10.1529/biophysj.107.113605. Epub 2007 Oct 5.

Life and times of a cellular bleb

Affiliations

Life and times of a cellular bleb

Guillaume T Charras et al. Biophys J. .

Abstract

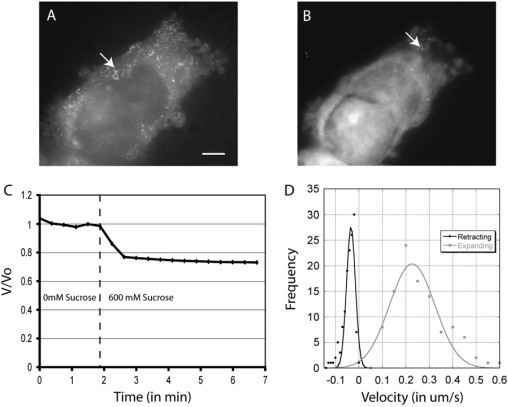
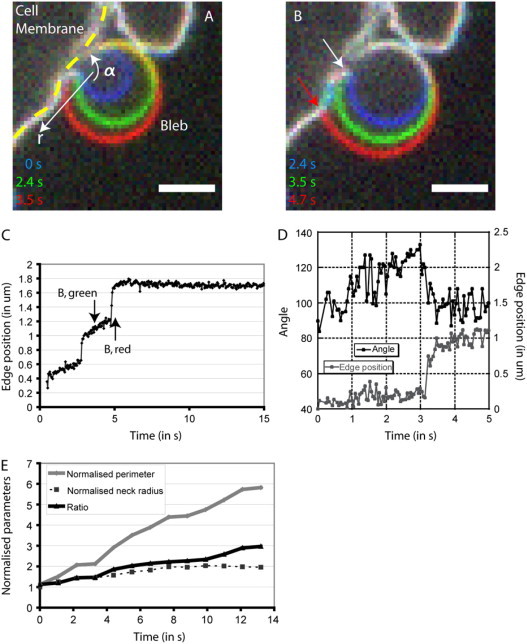
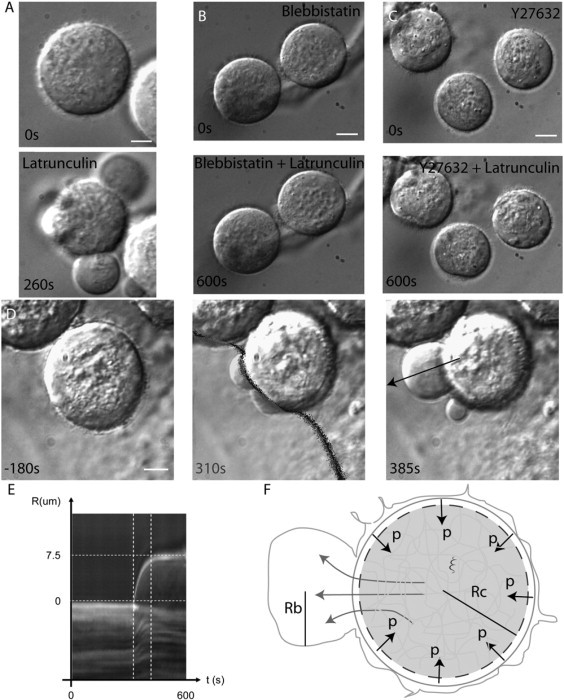
Blebs are spherical cellular protrusions that occur in many physiological situations. Two distinct phases make up the life of a bleb, each of which have their own biology and physics: expansion, which lasts approximately 30 s, and retraction, which lasts approximately 2 min. We investigate these phases using optical microscopy and simple theoretical concepts, seeking information on blebbing itself, and on cytomechanics in general. We show that bleb nucleation depends on pressure, membrane-cortex adhesion energy, and membrane tension, and test this experimentally. Bleb growth occurs through a combination of bulk flow of lipids and delamination from the cell cortex via the formation and propagation of tears. In extreme cases, this can give rise to a traveling wave around the cell periphery, known as "circus movement." When growth stalls, an actin cortex reforms under the bleb membrane, and retraction starts, driven by myosin-II. Using flicker spectroscopy, we find that retracting blebs are fivefold more rigid than expanding blebs, an increase entirely explained by the properties of the newly formed cortical actin mesh. Finally, using artificially nucleated blebs as pressure sensors, we show that cells rounded up in mitosis possess a substantial intracellular pressure.


Figures

Figure 1
Figure 1
Diagram of the different physical phases of blebbing along with possible theoretical predictions, experimental perturbations, and their outcomes, as well as the experimental technique used to assess the effect of perturbations.
Figure 2
Figure 2
Experimental determination of poroelastic parameters for blebbing cells. (A and B) Blebbing cell microinjected with quantum dots in isoosmotic solution (A) and in a hyperosmotic solution (B). Both images are the maximum projection of 200 frames representing a total of 2 s acquired using wide field-fluorescence microscopy. In isoosmotic solution, the quantum dots diffuse freely and their trajectory can clearly be seen (arrow, A). In hyperosmotic solution, the quantum dots appear frozen in place and do not move (arrow, B). Scale bar = 5 μm. (C) Cell volume decreases in response to a hyperosmotic shock. The graph was normalized to the average volume of the cell during the first five time points. 600 mM sucrose was added at t = 2 min. (D) Histogram of bleb expansion and retraction velocities.
Figure 3
Figure 3
Experimental variation of nucleation parameters. (A) Evolution of the number of blebs per cell per unit time as a function of the increase in extracellular osmolarity. (B) Evolution of the number of blebs per cell per unit time as a function of increasing concentration of the myosin II ATPase blocker blebbistatin. Increasing concentrations of blebbistatin block an increasing proportion of myosin motor heads and blebbing ceases. (C) Evolution of the number of blebs per cell per unit time as a function of increasing concentration of wheat germ agglutinin (a lectin known to cross-link membrane polysaccharides). (D) Effect of modulating cytoskeleton-membrane adhesion energy and myosin contractility. Increasing the adhesion energy between the cytoskeleton and the membrane by overexpressing a constitutively active form of the membrane-actin cross-linker ezrin decreased the number of blebs per unit perimeter per unit time. This effect could be partially compensated by increasing contractility by treating cells with the general phosphatase inhibitor calyculin.
Figure 4
Figure 4
Probability of bleb appearance as a function of position and time. (A) Cells transfected with GFP were imaged on a confocal microscope at 5 s intervals. The cell center was manually input and the cell area was divided into 360 sectors. Expansion and retraction were tracked along each sector independently to create a color-coded map of spatiotemporal cell behavior (B). Scale bar = 5 μm. (B) Spatiotemporal map of cell behavior. Time is shown on the horizontal axis and angular coordinates on the vertical axis. Red zones represent expansion, green zones retraction, and black zones no movement. (C) Probability of expansion on past expansion (pee(θ,t)). For t = 0 s, blebbing was impeded in angular sectors directly adjacent to θ = 0 (white arrows). For θ = 0, blebbing was impeded for short times before and after t = 0 s (black arrows). Increased probabilities of blebbing were found at short negative times for small angular sectors both positive and negative (red arrows). Biologically, this corresponds to there having been a bleb to the left or the right before bleb expansion at θ = 0. (D) Probability of expansion on past retraction (per(θ,t)). A retraction at θ = 0 for short positive or negative times gave rise to an increased probability of expansion per at t = 0 s and θ = 0 (white arrows). Retraction at t = 0 s for small positive or negative θ gave rise to increased blebbing probabilities (black arrows).
Figure 5
Figure 5
Mechanisms of bleb growth. (A) Increase in bleb volume can be accommodated through changes in the aspect ratio of blebs. Three times points are superimposed to show the evolution of aspect ratio. The cell membrane is delineated by the yellow dashed line. The position of the bleb is indicated. As the bleb increases in size, the angle of contact between the bleb membrane and the cell body increases (α). (B) Increase in bleb volume can cause tearing of the cell membrane from the cell body. Three time points are superimposed to show the evolution of the point and angle of contact between the bleb membrane and the cell body. When bleb volume increase becomes too great, more membrane tears from the cell body, the angle of contact drops, and the point of contact changes. For the first two time points (in blue and green), the point of contact between the bleb membrane and the cell body is shown by the white arrow. The point of contact for the last time point (in red) is shown by a red arrow and is clearly distinct from the point of contact for earlier time points. Panels A and B were acquired using spinning disk confocal microscopy. Scale bars = 2 μm. (C) Time course of the bleb edge position. The position of the membrane in the bleb is tracked over time along the white arrow in panel A. When there is no detachment, the position of the membrane varies smoothly and linearly because the angle of contact increases (white arrow in B, corresponding to the time point shown in green in B). When detachment occurs, the membrane position changes rapidly (∼2 μm s−1, red arrow in B, corresponding to the time point shown in red in B). (D) Time course of the angle and point of contact between the bleb membrane and the cell body (for the bleb shown in A and B). The angle increases linearly when there is no detachment and the point of contact stays constant (0–3 s). When detachment occurs, the angle drops rapidly and the point of contact changes (at 3 s). (E) Time course of the normalized perimeter, neck radius, and ratio of perimeter to neck radius. Both the normalized perimeter and the normalized neck radius increase as the bleb grows. However, the ratio of bleb perimeter/neck radius also increases, showing that there needs to be flow of membrane into the bleb.
Figure 6
Figure 6
Measurement of the bending rigidity of the bleb membrane. (A) Cells were transfected with the pleckstrin homology domain of Phospholipase C δ tagged with GFP, which highlights the cell membrane, and movies were acquired at high frame rate using spinning disk confocal microscopy. The angular sector denotes the part of the bleb membrane on which experimental measurements shown in panels B and C were effected. Scale bar = 5 μm. (B) Time course of the surface of the bleb shown in panel A. The bleb initially expands, then stays stationary, and finally retracts. (C) Temporal evolution of the bending rigidity and position of the bleb shown in panel A. During expansion, the bending rigidity of the bleb membrane is ∼4 10−20 N m. When retraction starts, the bending rigidity increases to ∼2 10−19 N m due to polymerization of an actin shell under the bleb membrane. (D) Ultrastructure of the submembranous actin shell acquired using scanning electron microscopy. The submembranous actin shell had a cagelike structure with distances between cross-links ∼100–200 nm apart. (E) Changes in bending rigidity of blebs in response to chemical treatments. Retracting blebs with a fully formed actin cytoskeleton had a fourfold higher bending rigidity than expanding blebs. In the absence of an actin cytoskeleton (expanding blebs or stationary blebs treated with latrunculin or cytochalasin), the bending rigidity of blebs was close to that of red blood cells. Treatment of blebs devoid of an actin cortex with wheat germ agglutinin resulted in a 9–12-fold increase in membrane-bending rigidity. (F) Changes in membrane tension of blebs in response to chemical treatments. Expanding and retracting blebs did not have significantly different membrane tensions. Blebs treated with actin depolymerizing drugs had significantly lower membrane tensions and this could be compensated by subsequent treatment with wheat germ agglutinin.
Figure 7
Figure 7
Mechanisms of bleb retraction. All images were acquired using spinning disk confocal microscopy. Scale bars = 2 μm. (A) Myosin dynamics during bleb retraction. Maximum projection of myosin intensity during bleb retraction. Myosin foci describe a centripetal trajectory and grow in intensity and breadth over time. (B) Actin dynamics during bleb retraction. Maximum projection of actin intensity during retraction. (C) Evolution of total myosin and actin intensity during retraction. Myosin intensity grew fourfold during retraction. Total actin intensity did not vary significantly. (D and E) Models for actin-based bleb retraction. Retraction can either be the result of interlayer actin filament sliding (D) or actin shell crumpling (E). The trajectory of actin monomers incorporated within the cortical shell moves toward the interior of the bleb if retraction proceeds through crumpling (E), whereas it moves toward the exterior of the bleb if retraction proceeds through interlayer sliding (D). (F) Trajectory of actin speckles incorporated within the cortical shell. Maximum projection of ∼60 time points representing ∼300 s. Actin speckles move toward the interior of the bleb as it retracts pointing toward a crumpling mechanism.
Figure 8
Figure 8
Membrane topography during retraction. (A) Membrane crumpling during retraction. As retraction proceeds, the membrane becomes more crumpled. Maximum projection of seven spinning disk confocal microscopy images. Scale bar = 2 μm. (B) Surface topography of a bleb. Image acquired using scanning electron microscopy. (C) Transmission electron microscopy image of the final stages of retraction of a bleb in a Hela cell blocked in metaphase. The membrane has a very convoluted morphology and an actin cortex (arrow) coats the underside of the bleb membrane. (Inset) Boxed location of the main image in relation to the whole cell. Scale bar = 500 nm. (D) Evolution of the bleb perimeter and bleb neck radius during retraction. The perimeter decreases linearly with time. The bleb neck radius does not change during retraction.
Figure 9
Figure 9
Circus movements. (A) A Bleb travels around the circumference of a Xenopus blastomere in fits and starts. Xenopus embryos were injected with PH-PLCδ-GFP mRNA. At time t = 0 s (red), the angle θ between the cell body and the bleb membrane is small. At t = 4 s (green), the angle has increased but the point of contact remains the same. At t = 10 s (blue), the membrane has torn from the cell body, the point of contact has changed, and the angle has decreased. Finally, retraction of the bleb is apparent at the rear. Three time points were superimposed on this image. The arrow shows the direction of travel and the angle θ is shown. Scale bar = 10 μm. (B) Hela cell blocked in metaphase transfected with MRLC-TDRFP (red) and actin-GFP (green). As the bleb travels counter-clockwise (direction shown by arrow at t = 0 s), an actinomyosin cortex is reformed at the trailing edge of the bleb (arrow, t = 26 s). Scale bar = 5 μm. Panels A and B were acquired using spinning disk microscopy. (C) Phase contrast image of a Xenopus blastomere. The direction of travel is indicated by the curved arrow. The white circle denotes the location of the kymograph shown in panel E. The straight arrow denotes the location of the kymograph shown in panel D. Scale bar = 10 μm. (D) Kymograph of the expansion and retraction kinetics normal to the cell body for the cell shown in panel C at the location marked by the straight arrow. Whereas expansion occurs mainly tangentially to the cell body, retraction occurs normal to the cell body. The kymograph can be utilized to measure retraction speed (dotted line). (E) Kymograph of bleb dynamics along the circle in panel C. The bleb travels around the whole circumference of the cell multiple times before reversing (arrow). The travel velocity at mid bleb-height stays relatively constant and can be measured (dotted line). (F) Velocity of the leading edge of a traveling bleb. The position of the point of contact between the bleb membrane and the cell body varies cyclically over time, alternating stationary periods with periods of rapid displacement. (G) Evolution of the angle and point of contact of the bleb over time. The angle between the bleb membrane and the cell body varies cyclically over time, alternating periods of increase with periods of decrease (location of angle indicated on panel A). When the angle between the bleb membrane and the cell body increases, the position of the point of contact varies little (3–8 s). Eventually, the angle reaches a value such that tearing occurs, the angle decreases, and the point of contact changes rapidly (8–11 s). Later, tearing reaches a steady state and proceeds as the angle changes (11–20 s).
Figure 10
Figure 10
Latrunculin-induced blebs in metaphase cells are due to an actinomyosin-mediated resting intracellular pressure. All images were acquired using differential interference contrast wide-field microscopy. Scale bars = 2 μm (A) or 5 μm (BD). (A) Hela cells blocked in metaphase have a rounded morphology. Treatment with latrunculin causes the emergence of a few large blebs (t = 260 s). (B) Pretreatment with the myosin II ATPase inhibitor blebbistatin prevents the emergence of latrunculin-induced blebs. (C) Pretreatment with the contractility inhibitor Y27632 prevents the emergence of latrunculin-induced blebs. (D) Local latrunculin treatment of a cell arrested in metaphase causes the emergence of blebs on the treated side only. The location of treatment is shown by the shaded zone (t = 310 s). (E) Kymograph of the velocity of the bleb from panel D (arrow on panel D, t = 385 s). (F) Line drawing of blebbing in metaphase cells. Rc is the cell radius, Rb the bleb radius, p the intracellular pressure, and ξ the pore size. When the membrane detaches from the cortex, cytosol rushes out from the cell body into the bleb.

References

    1. Fishkind D.J., Cao L.G., Wang Y.L. Microinjection of the catalytic fragment of myosin light chain kinase into dividing cells: effects on mitosis and cytokinesis. J. Cell Biol. 1991;114:967–975. - PMC - PubMed
    1. Paluch E., Sykes C., Prost J., Bornens M. Dynamic modes of the cortical actomyosin gel during cell locomotion and division. Trends Cell Biol. 2006;16:5–10. - PubMed
    1. Mills J.C., Stone N.L., Erhardt J., Pittman R.N. Apoptotic membrane blebbing is regulated by myosin light chain phosphorylation. J. Cell Biol. 1998;140:627–636. - PMC - PubMed
    1. Trinkaus J.P. Surface activity and locomotion of Fundulus deep cells during blastula and gastrula stages. Dev. Biol. 1973;30:69–103. - PubMed
    1. Friedl P., Wolf K. Tumor-cell invasion and migration: diversity and escape mechanisms. Nat. Rev. Cancer. 2003;3:362–374. - PubMed

Publication types

LinkOut - more resources