

Decoding of calcium oscillations by phosphorylation cycles: analytic results
- PMID: 17921221
- PMCID: PMC2212700
- DOI: 10.1529/biophysj.107.113084
Decoding of calcium oscillations by phosphorylation cycles: analytic results
Abstract
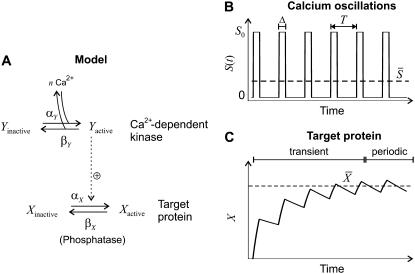
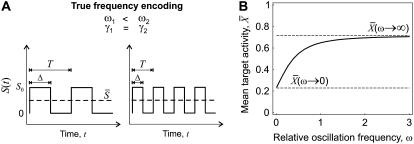
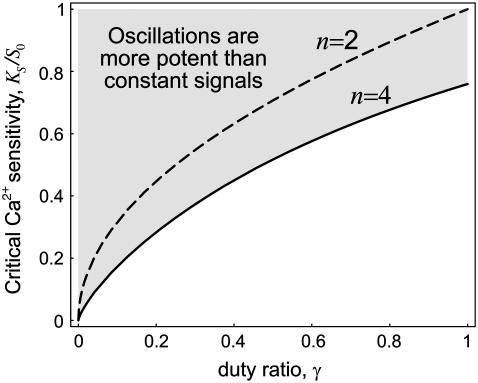
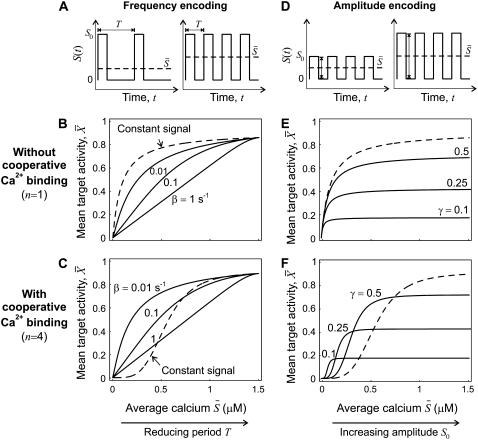
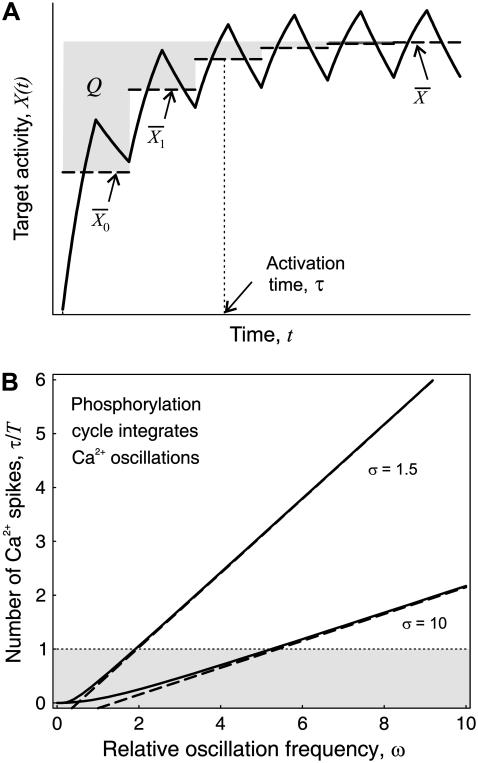
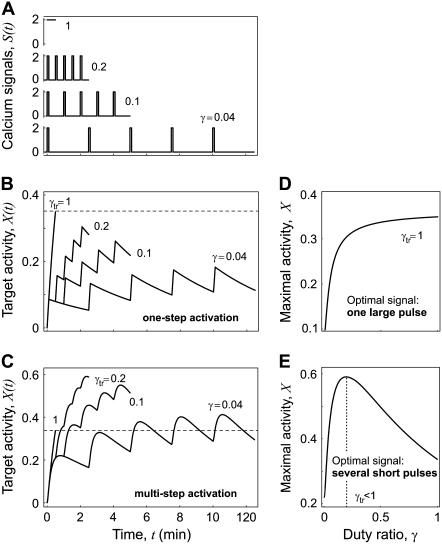
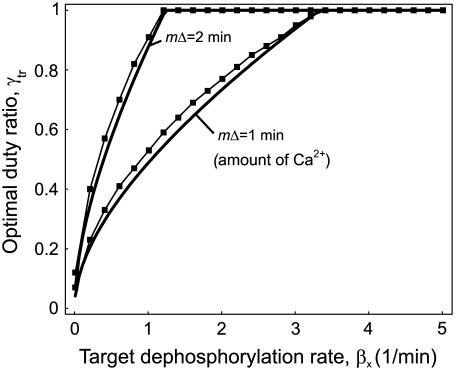
Experimental studies have demonstrated that Ca(2+)-regulated proteins are sensitive to the frequency of Ca(2+) oscillations, and several mathematical models for specific proteins have provided insight into the mechanisms involved. Because of the large number of Ca(2+)-regulated proteins in signal transduction, metabolism and gene expression, it is desirable to establish in general terms which molecular properties shape the response to oscillatory Ca(2+) signals. Here we address this question by analyzing in detail a model of a prototypical Ca(2+)-decoding module, consisting of a target protein whose activity is controlled by a Ca(2+)-activated kinase and the counteracting phosphatase. We show that this module can decode the frequency of Ca(2+) oscillations, at constant average Ca(2+) signal, provided that the Ca(2+) spikes are narrow and the oscillation frequency is sufficiently low--of the order of the phosphatase rate constant or below. Moreover, Ca(2+) oscillations activate the target more efficiently than a constant signal when Ca(2+) is bound cooperatively and with low affinity. Thus, the rate constants and the Ca(2+) affinities of the target-modifying enzymes can be tuned in such a way that the module responds optimally to Ca(2+) spikes of a certain amplitude and frequency. Frequency sensitivity is further enhanced when the limited duration of the external stimulus driving Ca(2+) signaling is accounted for. Thus, our study identifies molecular parameters that may be involved in establishing the specificity of cellular responses downstream of Ca(2+) oscillations.
Figures

Similar articles
-
What can we learn from the irregularity of Ca2+ oscillations?Chaos. 2009 Sep;19(3):037112. doi: 10.1063/1.3160569. Chaos. 2009. PMID: 19792037
-
From puffs to global Ca2+ signals: how molecular properties shape global signals.Chaos. 2009 Sep;19(3):037111. doi: 10.1063/1.3184537. Chaos. 2009. PMID: 19792036
-
Frequency decoding of calcium oscillations.Biochim Biophys Acta. 2014 Mar;1840(3):964-9. doi: 10.1016/j.bbagen.2013.11.015. Epub 2013 Nov 22. Biochim Biophys Acta. 2014. PMID: 24269537 Review.
-
A minimal model for decoding of time-limited Ca2+ oscillations.Biophys Chem. 2006 Apr 1;120(3):161-7. doi: 10.1016/j.bpc.2005.11.005. Epub 2005 Dec 9. Biophys Chem. 2006. PMID: 16338050
-
Coding and decoding of oscillatory Ca2+ signals.Semin Cell Dev Biol. 2019 Oct;94:11-19. doi: 10.1016/j.semcdb.2019.01.008. Epub 2019 Jan 25. Semin Cell Dev Biol. 2019. PMID: 30659886 Review.
Cited by
-
A Hill type equation can predict target gene expression driven by p53 pulsing.FEBS Open Bio. 2021 Jun;11(6):1799-1808. doi: 10.1002/2211-5463.13179. Epub 2021 May 27. FEBS Open Bio. 2021. PMID: 33955710 Free PMC article.
-
Decoding the Bell-Shaped Calcium Spikes in Phosphorylation Cycles of Flagella.Int J Mol Sci. 2022 Mar 29;23(7):3760. doi: 10.3390/ijms23073760. Int J Mol Sci. 2022. PMID: 35409111 Free PMC article.
-
A mathematical model of airway and pulmonary arteriole smooth muscle.Biophys J. 2008 Mar 15;94(6):2053-64. doi: 10.1529/biophysj.107.113977. Epub 2007 Dec 7. Biophys J. 2008. PMID: 18065464 Free PMC article.
-
Microdomain organization and frequency-dependence of CREB-dependent transcriptional signaling in heart cells.FASEB J. 2011 May;25(5):1544-55. doi: 10.1096/fj.10-176198. Epub 2011 Jan 19. FASEB J. 2011. PMID: 21248242 Free PMC article.
-
X-ray irradiation triggers immune response in human T-lymphocytes via store-operated Ca2+ entry and NFAT activation.J Gen Physiol. 2022 May 2;154(5):e202112865. doi: 10.1085/jgp.202112865. Epub 2022 Apr 13. J Gen Physiol. 2022. PMID: 35416945 Free PMC article.
References
-
- Berridge, M. J., M. D. Bootman, and P. Lipp. 1998. Calcium—a life and death signal. Nature. 395:645–648. - PubMed
-
- Lewis, R. S. 2001. Calcium signaling mechanisms in T-lymphocytes. Annu. Rev. Immunol. 19:497–521. - PubMed
-
- Feske, S., H. Okamura, P. G. Hogan, and A. Rao. 2003. Ca2+/calcineurin signaling in cells of the immune system. Biochem. Biophys. Res. Commun. 311:1117–1132. - PubMed
-
- Bito, H., and S. Takemoto-Kimura. 2003. Ca2+/CREB/CBP-dependent gene regulation: a shared mechanism critical in long-term synaptic plasticity and neuronal survival. Cell Calcium. 34:425–430. - PubMed
-
- Berridge, M. J., M. D. Bootman, and H. L. Roderick. 2003. Ca2+ signaling: dynamics, homeostasis and remodeling. Nat. Rev. Mol. Cell Biol. 4:517–529. - PubMed
Publication types
MeSH terms
Substances
LinkOut - more resources
Full Text Sources
Miscellaneous
