Comparative Study
. 2007 Oct 16;104(42):16615-20.
doi: 10.1073/pnas.0701538104. Epub 2007 Oct 5.

Comparing active and repressed expression states of genes controlled by the Polycomb/Trithorax group proteins

Affiliations
Comparative Study

Comparing active and repressed expression states of genes controlled by the Polycomb/Trithorax group proteins

Christian Beisel et al. Proc Natl Acad Sci U S A. .

Abstract

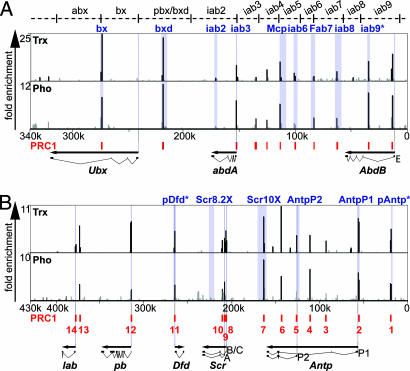
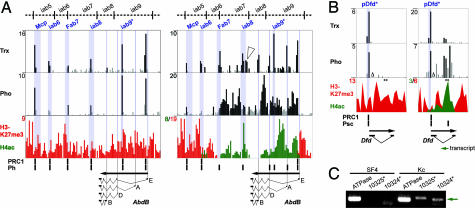
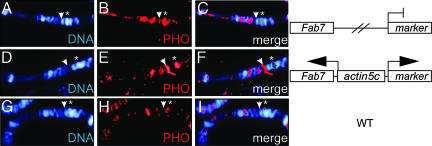
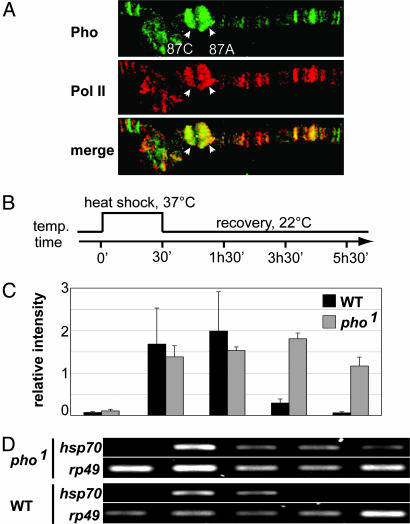
Drosophila Polycomb group (PcG) and Trithorax group (TrxG) proteins are responsible for the maintenance of stable transcription patterns of many developmental regulators, such as the homeotic genes. We have used ChIP-on-chip to compare the distribution of several PcG/TrxG proteins, as well as histone modifications in active and repressed genes across the two homeotic complexes ANT-C and BX-C. Our data indicate the colocalization of the Polycomb repressive complex 1 (PRC1) with Trx and the DNA binding protein Pleiohomeotic (Pho) at discrete sequence elements as well as significant chromatin assembly differences in active and inactive regions. Trx binds to the promoters of active genes and noncoding transcripts. Most strikingly, in the active state, Pho covers extended chromatin domains over many kilobases. This feature of Pho, observed on many polytene chromosome puffs, reflects a previously undescribed function. At the hsp70 gene, we demonstrate in mutants that Pho is required for transcriptional recovery after heat shock. Besides its presumptive function in recruiting PcG complexes to their site of action, our results now uncover that Pho plays an additional role in the repression of already induced genes.


Conflict of interest statement

The authors declare no conflict of interest.

Figures

Fig. 1.
Fig. 1.
At silent HOX genes, Trx and Pho colocalize at most elements with PRC1. Normalized ChIP/input ratios >1, indicating enriched fragments, are plotted across the BX-C (A) and ANT-C (B). The various regulatory regions of the BX-C (abx to iab9) are indicated at the top. Published PREs and promoters are indicated in blue; iab9* may be the PRE of the iab9 region. pDfd* and pAntp* have been identified in an algorithmic approach as potential PREs (30) but had not been experimentally confirmed previously. The coordinates based on the complete sequences of the BX-C (U31961, 0–340,000) and ANT-C (AE001572, 0–430,000) are shown on the x axis with proximal to the left. The HOX genes are drawn with exon structure. For AbdB, only the longest transcription unit (AbdB-RE) is indicated. Scr contains three alternative promoters, RA, RB, and RC; the latter two are not resolvable on our array. Antp contains two alternative transcription units, AntpP1 and AntpP2. PRC1-bound fragments identified in these cells are indicated in red at the bottom of the profiles (for more details, see SI Fig. 6). The numbers of PRC1 sites in B correspond to the numbering in SI Table 1 in which the coordinates of binding sites are listed. (B) Pho is missing at the lab and Scr-RB/C promoters. ChIP/input ratios with an FDR <5% are drawn in black.
Fig. 2.
Fig. 2.
Comparison of the active and repressed transcription states of AbdB and Dfd. (A) Pho spreading, promoter binding by Trx, and absence of PRC1 determine the active state of the AbdB domain. Shown is the protein distribution on the inactive (Left) and the active (Right) AbdB domain of Kc and SF4 cells, respectively. PREs and promoters are indicated as in Fig. 1. The arrowhead in the Trx profile shows the start of a ncRNA that is only present in the active state (D. Enderle and R.P., unpublished results). Fragments bound by PRC1 or Ph alone are indicated in black below the histone-modification profile. Red indicates H3K27me3, and green indicates H4ac. (B) An alternative chromatin composition maintains the active state of Dfd. Inactive (Left) and active (Right) Dfd gene of SF4 and Kc cells, respectively. The predicted Dfd PRE (pDfd*), which is located at the Dfd promoter, is indicated in blue. Fragments bound by PRC1 or Psc alone, are indicated in black below the histone modification profile. Δ indicates a fragment that is missing on the array. The green arrow indicates the antisense transcription we detected in two fragments located in the intron region of the active Dfd gene (**, fragment 10325 and 10324; 10325 is located to the proximal end). At fragment 10324, Psc and H4ac show peak enrichments. (C) RT-PCR analysis for the detection of antisense transcription in fragments 10325 and 10324 using total RNA isolated from Kc and SF4 cells. ATPase cf6 was used as positive control. In the absence of reverse transcriptase, no PCR product was detected in any of the reactions (data not shown).
Fig. 3.
Fig. 3.
Pho is found at sites of active gene transcription. The binding of Pho at the actively transcribed Fab7 PRE was investigated with a previously published transgenic reporter system (31). The transgene constructs are indicated on the right side. (A–C) The repressed Fab7 PRE on the transgene created an ectopic Pho binding site (arrow). (D–F) Transcription of Fab7 through the actin5C promoter leads to stronger Pho staining. (G–I) Wild-type control. There is no endogenous Pho binding at the transgene insertion site. Asterisks denote endogenous Pho binding at 32F.
Fig. 4.
Fig. 4.
Pho is present at highly induced genes on polytene chromosomes and is required for hsp70 recovery after heat shock. (A) After heat induction, Pho covers heat-shock loci completely (arrows at 87A and 87C) and additionally colocalizes with active, serine-5-phosphorylated RNA Pol II at many sites. A partial spread of chromosome 3R is shown. Pho is shown in green, and Pol II is shown in red; yellow indicates colocalization of both proteins. (B–D) Transcriptional recovery after heat-shock induction of hsp70 is slower in homozygous pho1 mutant larvae. (B) Experimental scheme. Larvae were heat shocked at 37°C for 30 min and afterward were transferred to 22°C for recovery. RNA was isolated at the indicated times and assayed by RT-PCR with primers specific for hsp70 and rp49 as standard. (C) Normalized values of quantified hsp70 RT-PCR products (hsp70/rp49-ratio). The standard deviation was calculated for two independent PCRs. (D) For one experiment, ethidium-bromide-stained gels are shown.

Similar articles

Cited by

References

    1. Ringrose L, Paro R. Annu Rev Genet. 2004;38:413–443. - PubMed
    1. Levine SS, King IF, Kingston RE. Trends Biochem Sci. 2004;29:478–485. - PubMed
    1. Muller J, Kassis JA. Curr Opin Genet Dev. 2006;16:476–484. - PubMed
    1. Francis NJ, Saurin AJ, Shao Z, Kingston RE. Mol Cell. 2001;8:545–556. - PubMed
    1. King IF, Francis NJ, Kingston RE. Mol Cell Biol. 2002;22:7919–7928. - PMC - PubMed

Publication types

MeSH terms

Associated data