. 2007 Oct;19(10):2975-87.
doi: 10.1105/tpc.107.052373. Epub 2007 Oct 5.

Arabidopsis relatives of the human lysine-specific Demethylase1 repress the expression of FWA and FLOWERING LOCUS C and thus promote the floral transition

Affiliations

Arabidopsis relatives of the human lysine-specific Demethylase1 repress the expression of FWA and FLOWERING LOCUS C and thus promote the floral transition

Danhua Jiang et al. Plant Cell. 2007 Oct.

Abstract

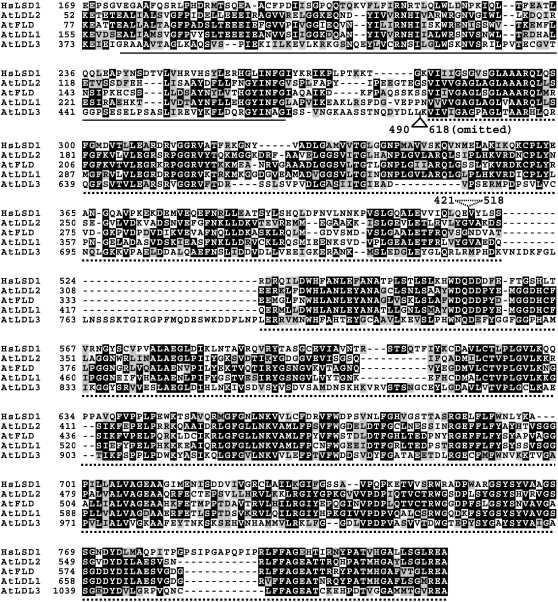
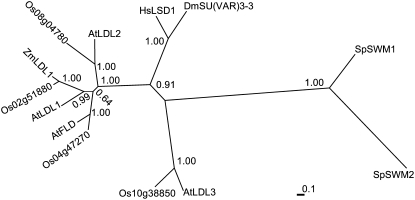
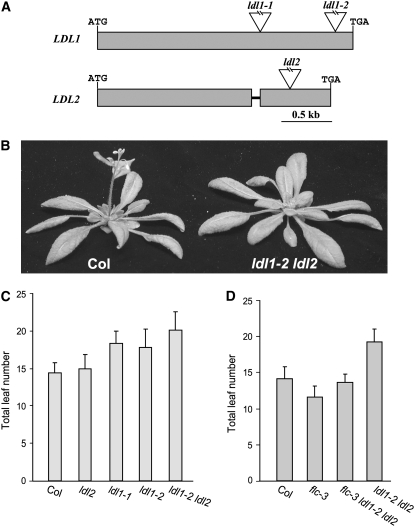
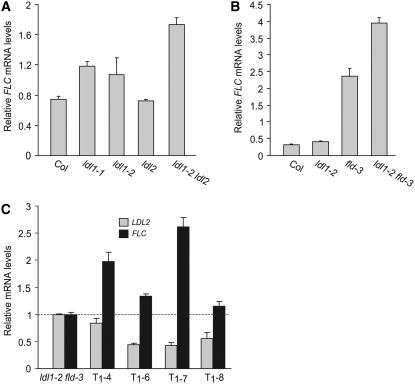
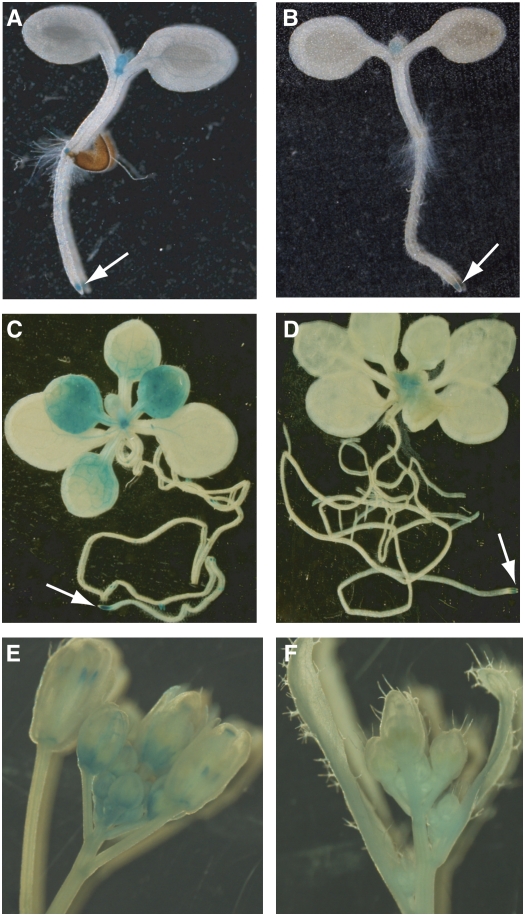
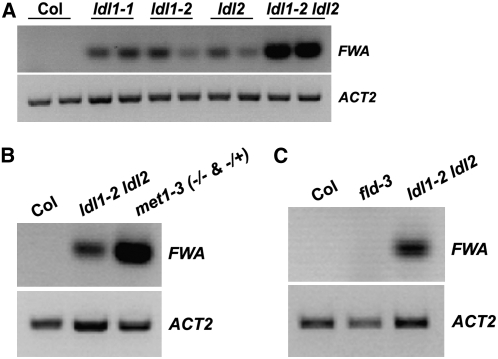
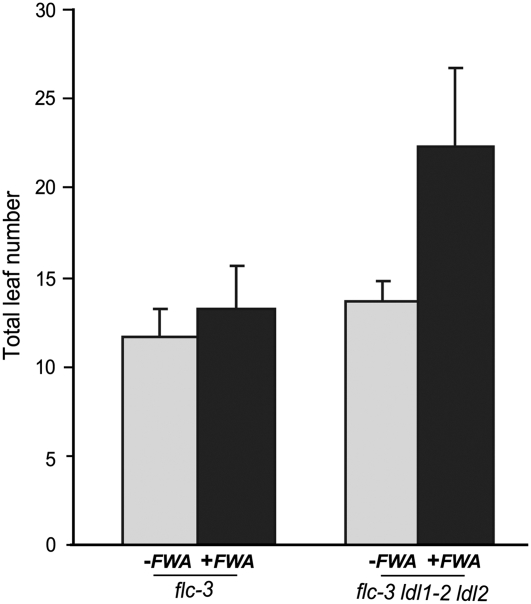
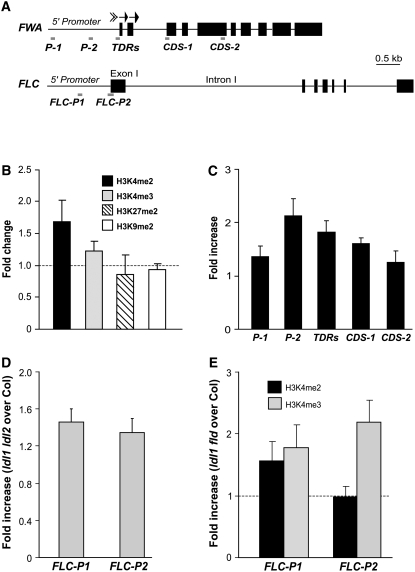
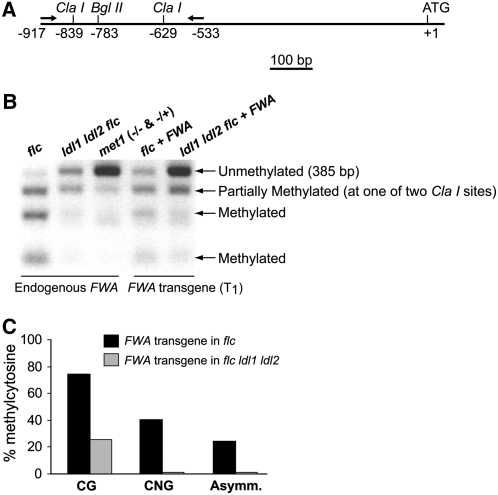
The timing of the developmental transition to flowering is critical to reproductive success in plants. Here, we show that Arabidopsis thaliana homologs of human Lysine-Specific Demethylase1 (LSD1; a histone H3-Lys 4 demethylase) reduce the levels of histone H3-Lys 4 methylation in chromatin of the floral repressor FLOWERING LOCUS C (FLC) and the sporophytically silenced floral repressor FWA. Two of the homologs, LSD1-LIKE1 (LDL1) and LSD1-LIKE2 (LDL2), act in partial redundancy with FLOWERING LOCUS D (FLD; an additional homolog of LSD1) to repress FLC expression. However, LDL1 and LDL2 appear to act independently of FLD in the silencing of FWA, indicating that there is target gene specialization within this histone demethylase family. Loss of function of LDL1 and LDL2 affects DNA methylation on FWA, whereas FLC repression does not appear to involve DNA methylation; thus, members of the LDL family can participate in a range of silencing mechanisms.


Figures

Figure 1.
Figure 1.
Amino Acid Sequence Alignment of Arabidopsis thaliana LDL1 (At LDL1), LDL2 (At LDL2), LDL3 (At LDL3), FLD (At FLD), and Homo sapiens LSD1 (Hs LSD1). Numbers refer to amino acid residues; identical residues are shaded with black, and similar residues are shaded with gray. The SWIRM domain is indicated with a solid line; the conserved histone demethylation domain is indicated with a broken line. The broken triangle indicates the spacer region of Hs LSD1 (Shi et al., 2004) omitted from the alignment; the solid triangle indicates a 129–amino acid region of At LDL3 omitted from the alignment because it does not align with the rest of the proteins.
Figure 2.
Figure 2.
Phylogenetic Tree of LSD1 Relatives in Different Organisms. The unrooted phylogram was generated using Mrbayes (version 3.1.2); amino acid sequences were aligned with ClustalW. At, Arabidopsis thaliana; Dm, Drosophila melanogaster; Hs, Homo sapiens; Os, Oryza sativa; Sp, Schizosaccharomyces pombe; Zm, Zea mays (Zm LDL1, AZM4_71848; http://maize.tigr.org). Sp SWM1 (SPBC146.09c) and Sp SWM2 (SPAC23E2.02) are distant relatives of Hs LSD1. Clade credibility (posterior probability) values for each branch are shown.
Figure 3.
Figure 3.
Phenotypes of ldl1, ldl2, and ldl1 ldl2. (A) Gene structure of LDL1 and LDL2. Exons are represented by closed boxes, and introns are represented by lines. Triangles indicate T-DNA insertions. (B) Phenotypes of Col and the ldl1 ldl2 mutant grown in LDs. (C) Flowering times of ldl1, ldl2, and ldl1 ldl2 mutants grown in LDs. The total number of primary rosette and cauline leaves at flowering was counted, and for each line at least 10 plants were scored. The values shown are means ± sd. (D) Flowering times of flc, ldl1 ldl2, and flc ldl1 ldl2 mutants grown in LDs. Total leaf number at flowering was scored. Fifteen plants were scored each for flc, flc ldl1 ldl2, and ldl1 ldl2; for Col, 10 plants were scored. The values shown are means ± sd.
Figure 4.
Figure 4.
Repression of FLC by LDLs. (A) Relative FLC mRNA levels in seedlings of ldl1, ldl2, and ldl1 ldl2 quantified by real-time PCR. (B) Relative FLC mRNA levels in seedlings of ldl1, fld, and ldl1 fld quantified by real-time PCR. (C) Relative mRNA levels of LDL2 and FLC in rosette leaves of ldl1 fld transformed with a double-stranded RNA interference construct targeting LDL2. Four independent T1 transgenic plants were examined; gray and black bars represent mRNA levels of LDL2 and FLC, respectively. The values shown are means ± sd.
Figure 5.
Figure 5.
Histochemical Analysis of the Expression of LDL1 and LDL2. (A), (C), and (E) Spatial expression patterns of LDL1 in 4-d-old seedlings (T1), ∼2-week-old plants (T2) grown on half-strength Murashige and Skoog medium, and inflorescence revealed by the GUS reporter gene driven by the LDL1 promoter plus the 5′ part of LDL1 CDS. (B), (D), and (F) Spatial expression patterns of LDL2 in 4-d-old seedlings (T1), ∼2-week-old plants (T2), and inflorescence revealed by GUS driven by the LDL2 promoter plus the 5′ part of LDL2 CDS.
Figure 6.
Figure 6.
Derepression of FWA in ldl1, ldl2, and ldl1 ldl2. (A) Ectopic activation of FWA in rosette leaves of ldl1, ldl2, and ldl1 ldl2. FWA transcripts were examined by RT-PCR, and duplicate lanes for each sample represent duplicate reactions. The constitutively expressed ACTIN2 served as a control. (B) Analysis of FWA expression in seedlings of ldl1-2 ldl2 and met1-3. (C) Analysis of FWA expression in rosette leaves of fld.
Figure 7.
Figure 7.
Flowering Times of flc and flc ldl1 ldl2 Mutants Transformed with the FWA Transgene. Plants were grown in LDs. Total leaf number at flowering was scored. Eighteen T1 transformants were scored for each transgenic population (flc and flc ldl1 ldl2 as described in Figure 3D). The values shown are means ± sd.
Figure 8.
Figure 8.
The Chromatin State of FLC and FWA in Col and ldl Mutants. (A) Schematic structure of genomic FWA and FLC and the regions analyzed by real-time quantitative PCR after ChIP. The arrows represent two sets of tandem direct repeats in FWA. (B) Histone methylation state of the heterochromatin domain in FWA chromatin in ldl1 ldl2 and Col seedlings analyzed by ChIP. Each of the immunoprecipitations was performed at least three times. The immunoprecipitated DNA (corresponding to region TDRs) was quantified by real-time PCR and subsequently normalized to an internal control (ACTIN2). The fold changes of ldl1 ldl2 over Col (i.e., the ratio of ldl1 ldl2 to Col) are shown, and the values shown are means ± sd. (C) H3K4me2 state of various regions in genomic FWA in ldl1 ldl2 and Col. The fold enrichments of ldl1 ldl2 over Col are shown, and the values shown are means ± sd. (D) H3K4me3 state in FLC chromatin in ldl1 ldl2 and Col seedlings. The fold enrichments of FLC in ldl1 ldl2 over Col are shown, and the values shown are means ± sd. (E) H3K4 methylation state in FLC chromatin in ldl1 fld and Col. Black and gray bars represent enrichments of H3K4me2 and H3K4me3, respectively. The fold enrichments of ldl1 fld over Col are shown, and the values shown are means ± sd.
Figure 9.
Figure 9.
Methylation Patterns of Endogenous FWA and the FWA Transgene. (A) Schematic drawing of 5′ FWA. Arrows depict the forward and reverse primers used to amplify the 5′ region of FWA. (B) Methylation patterns of endogenous FWA and the FWA transgene. Genomic DNA was treated with bisulfite; subsequently, part of the tandem repeats in the 5′ region of FWA was amplified by PCR and followed by ClaI restriction digestion. CpG methylation prevents ClaI restriction sites from bisulfite conversion, thus allowing digestion by ClaI after bisulfite treatment. To analyze the FWA transgene, genomic DNA was first digested with BglII to destroy the endogenous FWA. (C) FWA transgene (T1) cytosine methylation in CpG, CpNG, and asymmetric sites in flc and flc ldl1 ldl2.

References

    1. Alonso, J.M., et al. (2003). Genome-wide insertional mutagenesis of Arabidopsis thaliana. Science 301 653–657. - PubMed
    1. Alvarez-Venegas, R., and Avramova, Z. (2005). Methylation patterns of histone H3 Lys 4, Lys 9 and Lys 27 in transcriptionally active and inactive Arabidopsis genes and in atx1 mutants. Nucleic Acids Res. 33 5199–5207. - PMC - PubMed
    1. Aufsatz, W., Mette, M.F., van der Winden, J., Matzke, M., and Matzke, A.J. (2002). HDA6, a putative histone deacetylase needed to enhance DNA methylation induced by double-stranded RNA. EMBO J. 21 6832–6841. - PMC - PubMed
    1. Ausin, I., Alonso-Blanco, C., Jarillo, J.A., Ruiz-Garcia, L., and Martinez-Zapater, J.M. (2004). Regulation of flowering time by FVE, a retinoblastoma-associated protein. Nat. Genet. 36 162–166. - PubMed
    1. Balasubramanian, S., Sureshkumar, S., Lempe, J., and Weigel, D. (2006). Potent induction of Arabidopsis thaliana flowering by elevated growth temperature. PLoS Genet. 2 e106. - PMC - PubMed

Publication types