. 2007 Dec;145(4):1408-22.
doi: 10.1104/pp.107.106500. Epub 2007 Oct 5.

Silencing of the mitochondrial ascorbate synthesizing enzyme L-galactono-1,4-lactone dehydrogenase affects plant and fruit development in tomato

Affiliations

Silencing of the mitochondrial ascorbate synthesizing enzyme L-galactono-1,4-lactone dehydrogenase affects plant and fruit development in tomato

Moftah Alhagdow et al. Plant Physiol. 2007 Dec.

Abstract

L-Galactono-1,4-lactone dehydrogenase (EC 1.3.2.3) catalyzes the last step in the main pathway of vitamin C (L-ascorbic acid) biosynthesis in higher plants. In this study, we first characterized the spatial and temporal expression of SlGalLDH in several organs of tomato (Solanum lycopersicum) plants in parallel with the ascorbate content. P(35S):Slgalldh(RNAi) silenced transgenic tomato lines were then generated using an RNAi strategy to evaluate the effect of any resulting modification of the ascorbate pool on plant and fruit development. In all P(35S):Slgalldh(RNAi) plants with reduced SlGalLDH transcript and activity, plant growth rate was decreased. Plants displaying the most severe effects (dwarf plants with no fruit) were excluded from further analysis. The most affected lines studied exhibited up to an 80% reduction in SlGalLDH activity and showed a strong reduction in leaf and fruit size, mainly as a consequence of reduced cell expansion. This was accompanied by significant changes in mitochondrial function and altered ascorbate redox state despite the fact that the total ascorbate content remained unchanged. By using a combination of transcriptomic and metabolomic approaches, we further demonstrated that several primary, like the tricarboxylic acid cycle, as well as secondary metabolic pathways related to stress response were modified in leaves and fruit of P(35S):Slgalldh(RNAi) plants. When taken together, this work confirms the complexity of ascorbate regulation and its link with plant metabolism. Moreover, it strongly suggests that, in addition to ascorbate synthesis, GalLDH could play an important role in the regulation of cell growth-related processes in plants.


Figures

Figure 1.
Figure 1.
SlGalLDH expression and ascorbate content in cherry tomato plants and fruit. A, Relative SlGalLDH transcript levels in young leaves (Yl), mature leaves (Ml), root (Rt), stem (St), flower (Fl) and in fruit at 10 DPA, 20 DPA, mature green (MG), orange (Or), and red ripe (RR) stages. Data obtained by semiquantitative RT-PCR were normalized against Actin1 mRNA and are expressed as a ratio of arbitrary units. B, Total ascorbate content in the various tomato organs. Data represent mean ± sd of measurements of 10 organs per plant with six individual plants per line (n = 60). C, Detection of SlGalLDH transcripts in developing tomato organs by in situ hybridization. Longitudinal sections of shoot apical meristem (A), root apical meristem (B), young leaf (C), 9 mm flower bud (D), and cross section of fruit at 7 DPA (E) and 20 DPA (F) were prepared and analyzed as described in the experimental procedures. Hybridization signal appears as dark staining. Inserts are negative control corresponding to sense riboprobe. Scale bar = 500 μm.
Figure 2.
Figure 2.
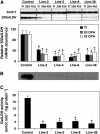
SlGalLDH expression, protein, and activity in P35S:SlgalldhRNAi transgenic and control plants. A, SlGalLDH mRNA relative abundance was determined in young leaves (Yl) and fruit at 20 and 42 DPA (orange stage) in P35S:SlgalldhRNAi plants (line 2, 5, 8, and 38) and compared to control plants. Data obtained by semiquantitative RT-PCR were normalized against Actin1 mRNA and are expressed as percentage of control. Data represent mean ± sd of six individual plants per line. B, Immunodetection of SlGalLDH protein in young leaves from P35S:SlgalldhRNAi line 2, 5, 8, and 38 and control plants. C, SlGalLDH activity in young leaves from P35S:SlgalldhRNAi line 2, 5, 8, and 38 compared to control plants. Data represent mean ± sd of six individual plants per line. Asterisks above bars indicate values that were determined by the t test to be significantly different (P < 0.05) from control.
Figure 3.
Figure 3.
Ascorbate accumulation in tomato leaves. Leaf stripes from P35S:SlgalldhRNAi transgenic line 5 (▵), line 8 (□), and control (○) plants were incubated in Murashige and Skoog (white symbols) or Murashige and Skoog containing 25 mm l-GalL (black symbols) in the light. Total ascorbate was assayed as described in “Materials and Methods.” The error bars indicate ses (n = 3).
Figure 4.
Figure 4.
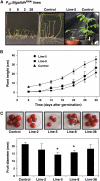
Phenotypic comparison between P35S:SlgalldhRNAi transgenic and control plants. A, Germination and plant growth. Left and middle section, seedlings from P35S:SlgalldhRNAi line 2, 5, 8, and 38 and from control at 10 DAS; right section, 6-week-old plants from severely affected P35S:SlgalldhRNAi line 5 and from control. B, Growth kinetic. Plant height from P35S:SlgalldhRNAi lines 5 and 8 and from control were measured every 4 d starting from 6 d after germination. Data represent mean ± sd of 10 individual plants. C, Fruit size. Top section, pictures of ripe fruit from P35S:SlgalldhRNAi lines 2, 5, 8, and 38 and from control; bottom section, fruit diameter measured on 42 DPA fruit. Data represent mean ± sd of 10 fruits per plant with six individual plants per line (n = 60 fruits). Asterisks above bars indicate values that were determined by the t test to be significantly different (P < 0.05) from control.
Figure 5.
Figure 5.
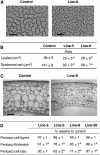
Microscopic analysis of leaf and fruit pericarp of P35S:SlgalldhRNAi transgenic and control plants. A, Micrograph of collodion imprint of adaxial epidermal cells of fully expanded fourth leaf from P35S:SlgalldhRNAi line 8 and control plant. Scale bar = 100 μm. B, Leaflet area and adaxial epidermal cell size of fully expanded fourth and fifth leaf from P35S:SlgalldhRNAi lines 5 and 8 and control plant. The region examined was located between two midveins in the first 5 cm of the leaflet. Data represent mean ± sd of four individual leaves per plant with six plants per line (n = 24). C, Micrograph of pericarp section of 20 DPA fruit from P35S:SlgalldhRNAi line 5, 8, and control. Scale bar = 200 μm. D, Pericarp thickness, number of cell layers, and cell size of 20 DPA fruit from P35S:SlgalldhRNAi lines 2, 5, 8, and 38 and control. Measurements were done by in situ observations of a region of interest located between the vessels in transverse pericarp sections from the equatorial region of the fruit. Data represent the mean ± sd of pericarp sections from 10 fruits per plant with six individual plants per line (n = 60). a, Values that were determined by the t test to be significantly different (P < 0.05) from control.
Figure 6.
Figure 6.
Description of central metabolism of fully expanded leaves and orange fruits from plants of the P35S:SlgalldhRNAi line 8. Metabolite content of leaf and orange fruit were determined as described in “Materials and Methods.” Data were normalized with respect to the mean response calculated for the control (to allow statistical assessment, individual samples from this set of plants were normalized in the same way). A color code indicates that values for metabolite content were determined by the t test to be significantly different (P < 0.05) from control (empty vector transgenic plant). Metabolites marked in red indicate that their relative content was decreased with respect to the control, and those marked in blue were increased. Examples of metabolite changes are represented by the values (mean ± se) of determinations of six individuals plants with 10 leaves and fruits of each plant. Abbreviations: G6P, Glc-6-P; 3-PGA, 3-phosphoglycerate; F6P, Fru-6-P; FA16:0, palmitate; FA18:0, stearate; PEP, phosphoenolpyruvate.

Similar articles

Cited by

References

    1. Agius F, Gonzalez-Lamonthe R, Caballero JL, Munoz-Blanco L, Botella MA, Valpuesta V (2003) Engineering increased vitamin C levels in plants by over-expression of a D-galacturonic acid reductase. Nat Biotechnol 21 177–181 - PubMed
    1. Alba R, Fei Z, Payton P, Liu Y, Moore SL, Debbie P, Cohn J, D'Ascenzo M, Gordon JS, Rose JK, et al (2004) ESTs, cDNA microarrays, and gene expression profiling: tools for dissecting plant physiology and development. Plant J 39 697–714 - PubMed
    1. Andrews PK, Fahy DA, Foyer CH (2004) Relationships between fruit exocarp antioxidants in the tomato (Lycopersicon esculentum) high pigment-1 mutant during development. Physiol Plant 120 519–528 - PubMed
    1. Balmer Y, Vensel WH, Tanaka CK, Hurkman WJ, Gelhaye E, Rouhier N, Jacquot JP, Manieri W, Schurmann P, Droux M, et al (2004) Thioredoxin links redox to the regulation of fundamental processes of plant mitochondria. Proc Natl Acad Sci USA 101 2642–2647 - PMC - PubMed
    1. Bartoli CG, Guiamet JJ, Kiddle G, Pastori GM, Di Cagno R, Theodoulou FL, Foyer CH (2005) Ascorbate content of wheat leaves is not determined by maximal L-galactono-1,4-lactone dehydrogenase (GalLDH) activity under drought stress. Plant Cell Environ 28 1073–1081

Publication types

MeSH terms

Substances