

PennCNV: an integrated hidden Markov model designed for high-resolution copy number variation detection in whole-genome SNP genotyping data
- PMID: 17921354
- PMCID: PMC2045149
- DOI: 10.1101/gr.6861907
PennCNV: an integrated hidden Markov model designed for high-resolution copy number variation detection in whole-genome SNP genotyping data
Abstract
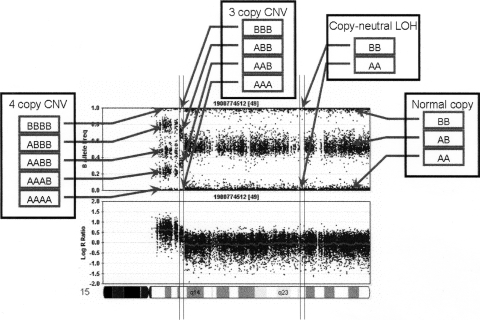
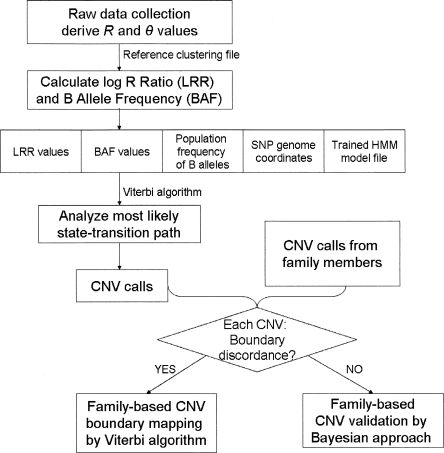
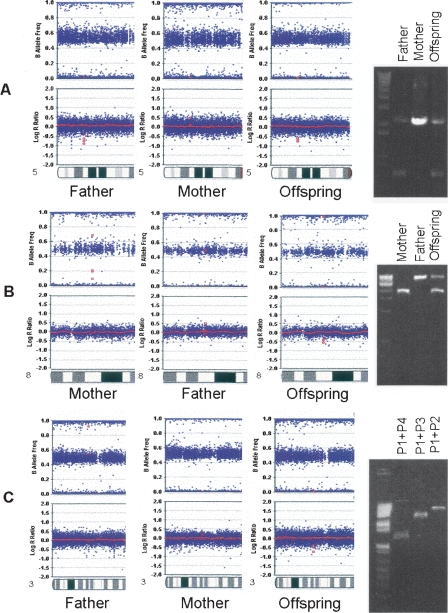
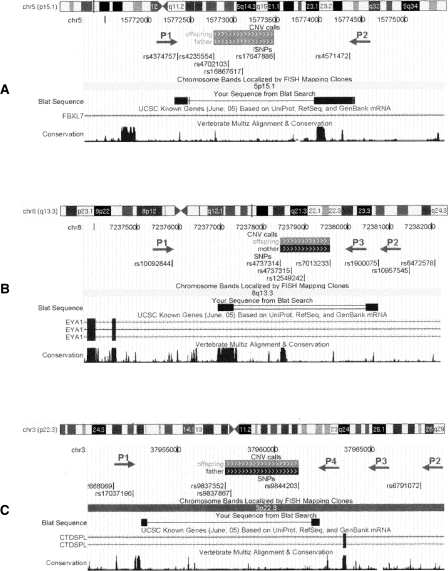
Comprehensive identification and cataloging of copy number variations (CNVs) is required to provide a complete view of human genetic variation. The resolution of CNV detection in previous experimental designs has been limited to tens or hundreds of kilobases. Here we present PennCNV, a hidden Markov model (HMM) based approach, for kilobase-resolution detection of CNVs from Illumina high-density SNP genotyping data. This algorithm incorporates multiple sources of information, including total signal intensity and allelic intensity ratio at each SNP marker, the distance between neighboring SNPs, the allele frequency of SNPs, and the pedigree information where available. We applied PennCNV to genotyping data generated for 112 HapMap individuals; on average, we detected approximately 27 CNVs for each individual with a median size of approximately 12 kb. Excluding common rearrangements in lymphoblastoid cell lines, the fraction of CNVs in offspring not detected in parents (CNV-NDPs) was 3.3%. Our results demonstrate the feasibility of whole-genome fine-mapping of CNVs via high-density SNP genotyping.
Figures
References
-
- Aardema M.J., Crosby L.L., Gibson D.P., Kerckaert G.A., LeBoeuf R.A., Crosby L.L., Gibson D.P., Kerckaert G.A., LeBoeuf R.A., Gibson D.P., Kerckaert G.A., LeBoeuf R.A., Kerckaert G.A., LeBoeuf R.A., LeBoeuf R.A. Aneuploidy and consistent structural chromosome changes associated with transformation of Syrian hamster embryo cells. Cancer Genet. Cytogenet. 1997;96:140–150. - PubMed
-
- Bailey J.A., Yavor A.M., Massa H.F., Trask B.J., Eichler E.E., Yavor A.M., Massa H.F., Trask B.J., Eichler E.E., Massa H.F., Trask B.J., Eichler E.E., Trask B.J., Eichler E.E., Eichler E.E. Segmental duplications: Organization and impact within the current human genome project assembly. Genome Res. 2001;11:1005–1017. - PMC - PubMed
-
- Baum L.E., Petrie T., Soules G., Weiss N., Petrie T., Soules G., Weiss N., Soules G., Weiss N., Weiss N. A maximization technique occurring in the statistical analysis of probabilistic functions of Markov chains. Ann Math. Statist. 1970;41:164–171.
-
- Colella S., Yau C., Taylor J.M., Mirza G., Butler H., Clouston P., Bassett A.S., Seller A., Holmes C.C., Ragoussis J., Yau C., Taylor J.M., Mirza G., Butler H., Clouston P., Bassett A.S., Seller A., Holmes C.C., Ragoussis J., Taylor J.M., Mirza G., Butler H., Clouston P., Bassett A.S., Seller A., Holmes C.C., Ragoussis J., Mirza G., Butler H., Clouston P., Bassett A.S., Seller A., Holmes C.C., Ragoussis J., Butler H., Clouston P., Bassett A.S., Seller A., Holmes C.C., Ragoussis J., Clouston P., Bassett A.S., Seller A., Holmes C.C., Ragoussis J., Bassett A.S., Seller A., Holmes C.C., Ragoussis J., Seller A., Holmes C.C., Ragoussis J., Holmes C.C., Ragoussis J., Ragoussis J. QuantiSNP: An objective Bayes Hidden-Markov Model to detect and accurately map copy number variation using SNP genotyping data. Nucleic Acids Res. 2007;35:2013–2025. - PMC - PubMed
Publication types
MeSH terms
Grants and funding
LinkOut - more resources
Full Text Sources
Other Literature Sources
Molecular Biology Databases
Research Materials