

A system for modelling cell-cell interactions during plant morphogenesis
- PMID: 17921524
- PMCID: PMC2710276
- DOI: 10.1093/aob/mcm235
A system for modelling cell-cell interactions during plant morphogenesis
Abstract
Background and aims: During the development of multicellular organisms, cells are capable of interacting with each other through a range of biological and physical mechanisms. A description of these networks of cell-cell interactions is essential for an understanding of how cellular activity is co-ordinated in regionalized functional entities such as tissues or organs. The difficulty of experimenting on living tissues has been a major limitation to describing such systems, and computer modelling appears particularly helpful to characterize the behaviour of multicellular systems. The experimental difficulties inherent to the multitude of parallel interactions that underlie cellular morphogenesis have led to the need for computer models.
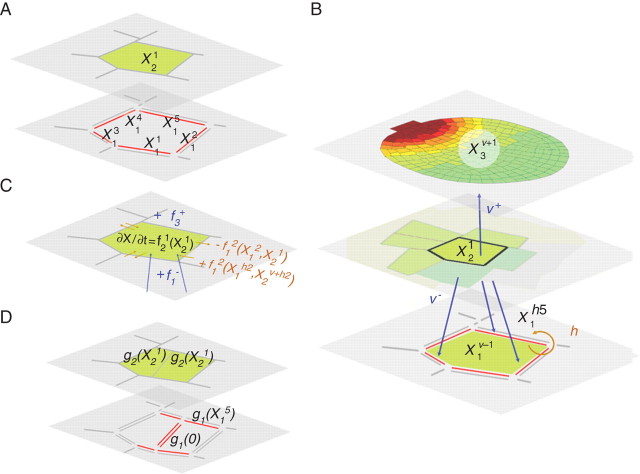
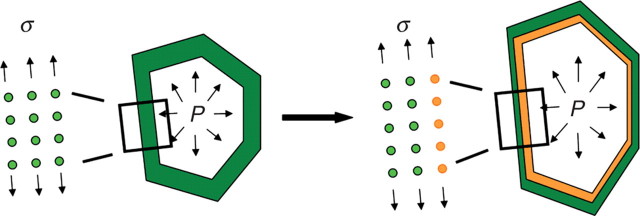
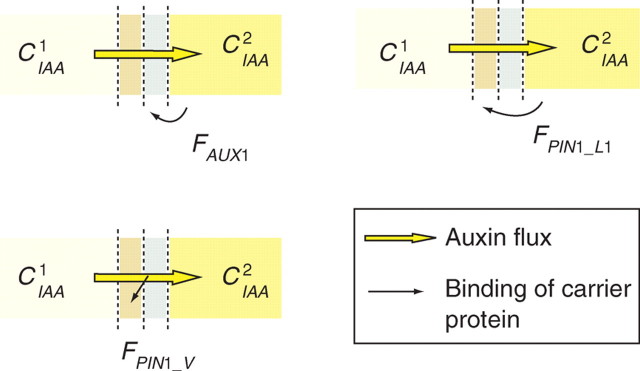
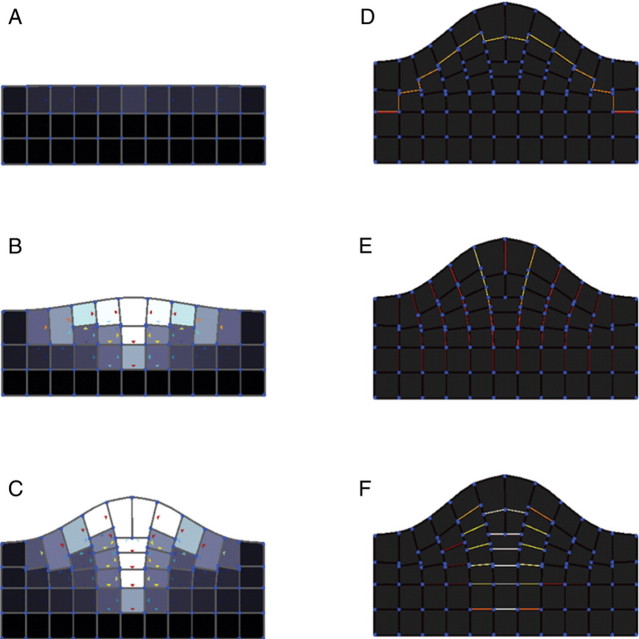
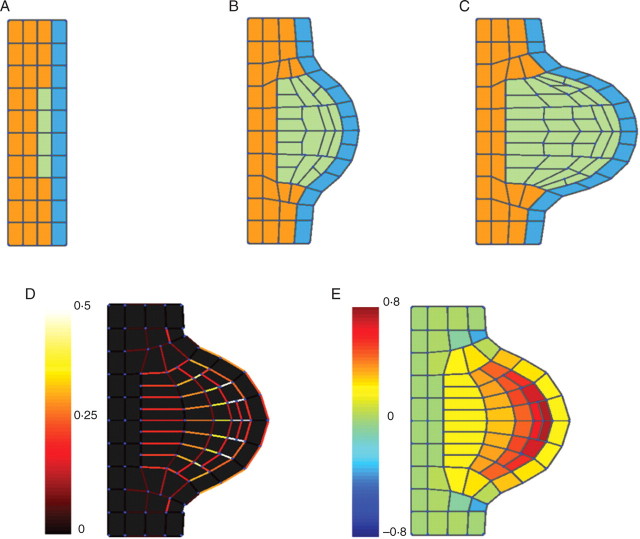
Methods: A new generic model of plant cellular morphogenesis is described that expresses interactions amongst cellular entities explicitly: the plant is described as a multi-scale structure, and interactions between distinct entities is established through a topological neighbourhood. Tissues are represented as 2D biphasic systems where the cell wall responds to turgor pressure through a viscous yielding of the cell wall.
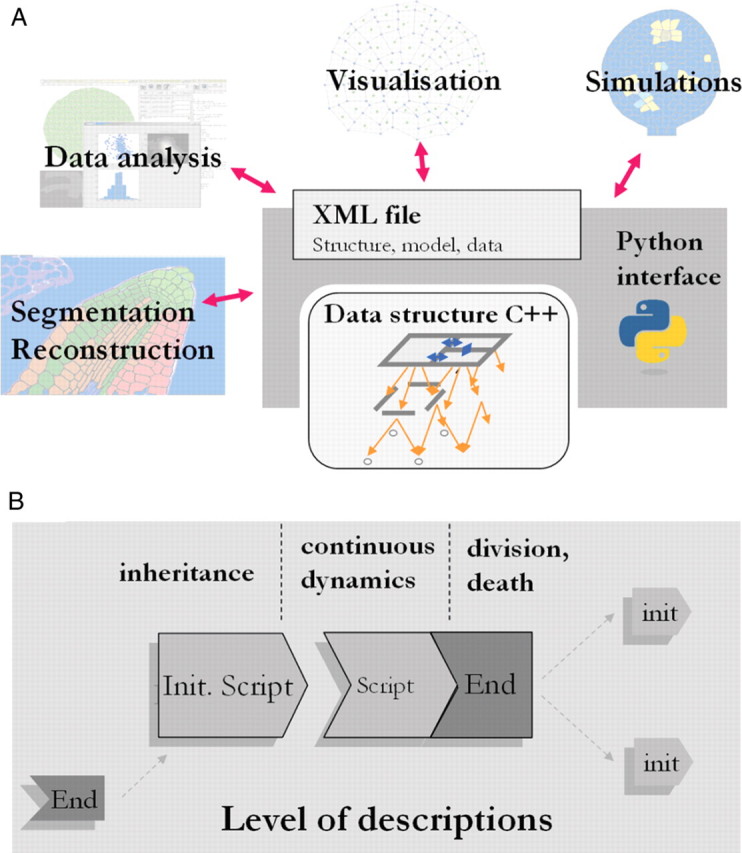
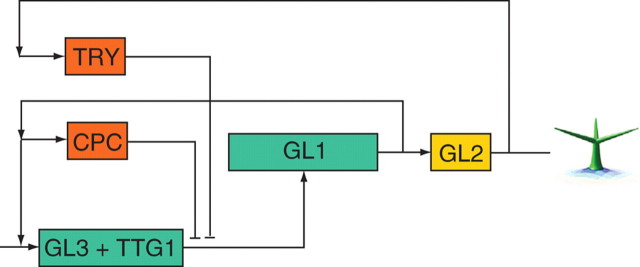
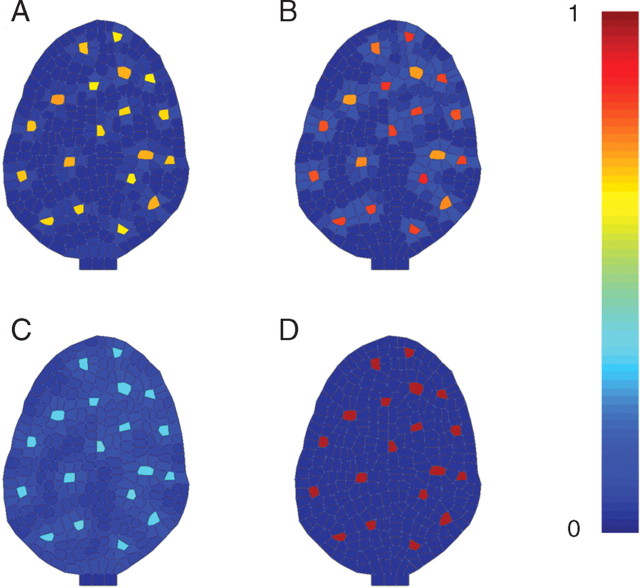
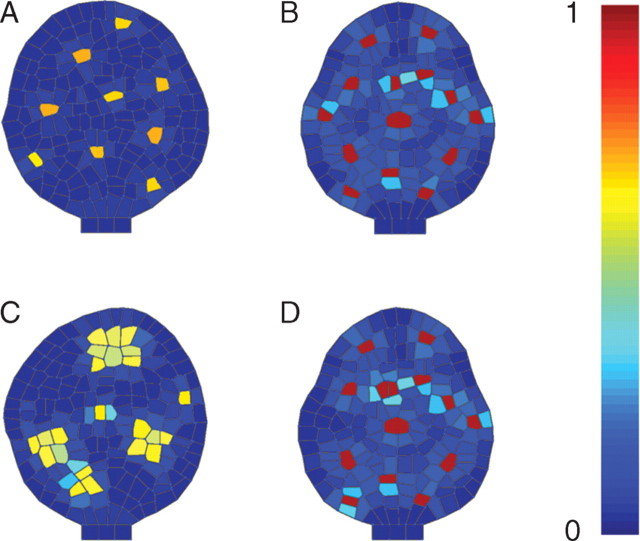
Key results: This principle was used in the development of the CellModeller software, a generic tool dedicated to the analysis and modelling of plant morphogenesis. The system was applied to three contrasting study cases illustrating genetic, hormonal and mechanical factors involved in plant morphogenesis.
Conclusions: Plant morphogenesis is fundamentally a cellular process and the CellModeller software, through its underlying generic model, provides an advanced research tool to analyse coupled physical and biological morphogenetic mechanisms.
Figures
Similar articles
-
CompuCell, a multi-model framework for simulation of morphogenesis.Bioinformatics. 2004 May 1;20(7):1129-37. doi: 10.1093/bioinformatics/bth050. Epub 2004 Feb 5. Bioinformatics. 2004. PMID: 14764549
-
Revisiting the relationship between turgor pressure and plant cell growth.New Phytol. 2023 Apr;238(1):62-69. doi: 10.1111/nph.18683. Epub 2023 Jan 13. New Phytol. 2023. PMID: 36527246 Review.
-
Quantitative multivariate analysis of dynamic multicellular morphogenic trajectories.Integr Biol (Camb). 2015 Jul;7(7):825-33. doi: 10.1039/c5ib00072f. Integr Biol (Camb). 2015. PMID: 26095427 Free PMC article.
-
Shrinking the hammer: micromechanical approaches to morphogenesis.J Exp Bot. 2013 Nov;64(15):4651-62. doi: 10.1093/jxb/ert169. Epub 2013 Jul 19. J Exp Bot. 2013. PMID: 23873995 Review.
-
A computational framework for 3D mechanical modeling of plant morphogenesis with cellular resolution.PLoS Comput Biol. 2015 Jan 8;11(1):e1003950. doi: 10.1371/journal.pcbi.1003950. eCollection 2015 Jan. PLoS Comput Biol. 2015. PMID: 25569615 Free PMC article.
Cited by
-
Vertex-element models for anisotropic growth of elongated plant organs.Front Plant Sci. 2013 Jul 10;4:233. doi: 10.3389/fpls.2013.00233. eCollection 2013. Front Plant Sci. 2013. PMID: 23847638 Free PMC article.
-
VirtualLeaf: an open-source framework for cell-based modeling of plant tissue growth and development.Plant Physiol. 2011 Feb;155(2):656-66. doi: 10.1104/pp.110.167619. Epub 2010 Dec 9. Plant Physiol. 2011. PMID: 21148415 Free PMC article.
-
Shaping the Organ: A Biologist Guide to Quantitative Models of Plant Morphogenesis.Front Plant Sci. 2021 Oct 5;12:746183. doi: 10.3389/fpls.2021.746183. eCollection 2021. Front Plant Sci. 2021. PMID: 34675952 Free PMC article. Review.
-
Coupling water fluxes with cell wall mechanics in a multicellular model of plant development.PLoS Comput Biol. 2019 Jun 20;15(6):e1007121. doi: 10.1371/journal.pcbi.1007121. eCollection 2019 Jun. PLoS Comput Biol. 2019. PMID: 31220080 Free PMC article.
-
Generation of diverse biological forms through combinatorial interactions between tissue polarity and growth.PLoS Comput Biol. 2011 Jun;7(6):e1002071. doi: 10.1371/journal.pcbi.1002071. Epub 2011 Jun 16. PLoS Comput Biol. 2011. PMID: 21698124 Free PMC article.
References
-
- Barbier de Reuille P, Bohn-Courseau I, Godin C, Traas J. A protocol to analyse cellular dynamics during plant development. The Plant Journal. 2005;44:1045–1053. - PubMed
-
- Bengough AG, Bransby MF, Hans J, McKenna SJ, Roberts TJ, Valentine TA. Root responses to soil physical conditions: growth dynamics from field to cell. Journal of Experimental Botany. 2006;57:437–447. - PubMed
-
- Benitez M, Espinosa-Soto C, Padilla-Longoria P, Diaz J, Alvarez-Buylla ER. Equivalent genetic regulatory networks in different contexts recover contrasting spatial cell patterns that resemble those in Arabidopsis root and leaf epidermis: a dynamic model. International Journal of Developmental Biology. 2007;51:139–155. - PubMed
-
- Benkova E, Michniewicz M, Sauer M, Teichmann T, Seifertova D, Jurgens G, et al. Local, efflux-dependent auxin gradients as a common module for plant organ formation. Cell. 2003;115:591–602. - PubMed
