. 2007 Nov;10(11):1474-82.
doi: 10.1038/nn1976. Epub 2007 Oct 7.

Sensory processing in the Drosophila antennal lobe increases reliability and separability of ensemble odor representations

Affiliations

Sensory processing in the Drosophila antennal lobe increases reliability and separability of ensemble odor representations

Vikas Bhandawat et al. Nat Neurosci. 2007 Nov.

Abstract

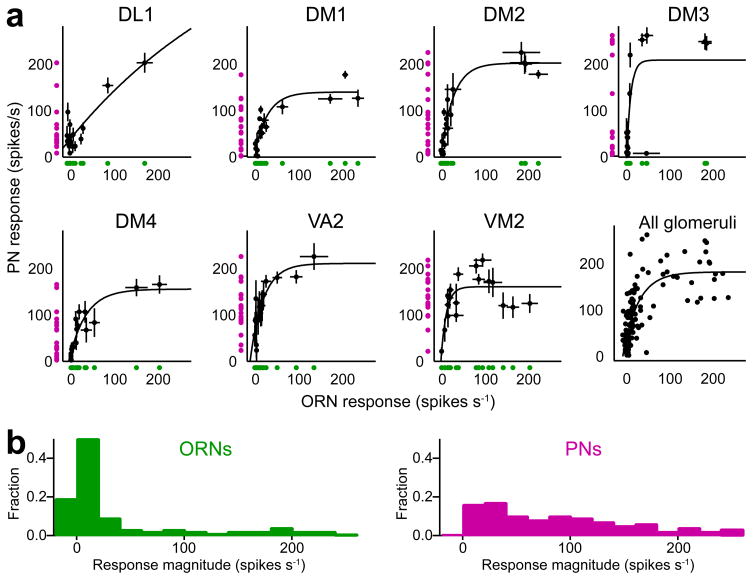
Here we describe several fundamental principles of olfactory processing in the Drosophila melanogaster antennal lobe (the analog of the vertebrate olfactory bulb), through the systematic analysis of input and output spike trains of seven identified glomeruli. Repeated presentations of the same odor elicit more reproducible responses in second-order projection neurons (PNs) than in their presynaptic olfactory receptor neurons (ORNs). PN responses rise and accommodate rapidly, emphasizing odor onset. Furthermore, weak ORN inputs are amplified in the PN layer but strong inputs are not. This nonlinear transformation broadens PN tuning and produces more uniform distances between odor representations in PN coding space. In addition, portions of the odor response profile of a PN are not systematically related to their direct ORN inputs, which probably indicates the presence of lateral connections between glomeruli. Finally, we show that a linear discriminator classifies odors more accurately using PN spike trains than using an equivalent number of ORN spike trains.


Figures

Figure 1
Figure 1. Odor responses are more reliable in PNs than in ORNs
(a) An ORN and a PN corresponding to the same glomerulus (VA2) responding to the same odor (geranyl acetate). Each tick represents a spike, and each row in a raster represents a different trial. Gray bar is 500-ms odor stimulus period. (b) Mean odor responses are larger in PNs (magenta) than in ORNs (green). Spikes were counted in 50-ms bins and averaged across 5 trials with the same odor, then averaged across all blocks of trials (all odors and all experiments). Gray bar is stimulus period, black bar is 100-ms period when average PN firing rates are maximal. (c) SD of spike counts in 5 trials with the same odor, averaged across all blocks of trials (all odors and all experiments). (d) Coefficient of variation (SD/mean) of spike counts in 5 trials with the same odor, averaged across all blocks of trials. Note that the CV of PN responses drops again after odor offset. This is because some responses contain zero spikes for an epoch following odor offset, and so the SD in these bins is zero for some responses. (e) Average SD of spike counts is lower for PNs than for ORNs even when mean firing rates are matched. SDs were measured for all counting windows in all blocks of trials, binned according to mean firing rate, and averaged across all counting windows in the same bin. Note that because SD depends sublinearly on mean, average CV is larger than (average SD)/(average mean).
Figure 2
Figure 2. PNs preferentially transmit the rising phase of ORN signals
(a) Average peak-normalized peri-stimulus time histograms (PSTHs), averaged across all odors and all glomeruli (± s.e.m.). Note that PN responses rise and decay more rapidly than ORN responses. Odor stimulation begins at 0 ms and ends at 500 ms. (b) An example comparing the responses of pre- and postsynaptic neurons to the same odor. PSTHs show the average response of ORNs and PNs in glomerulus VA2 to geranyl acetate (mean ± s.e.m., averaged across experiments). Note that the PN response is robust at a time point when the ORNs have just begun to respond, and the PN response begins decaying before the ORNs have peaked. (c) Another example: PSTHs for ORNs and PNs in glomerulus DM1 showing responses to ethyl butyrate. The PN response rises faster and peaks earlier, even though in this case the PN peak is smaller. (d) Compared to ORN responses, PN responses have a shorter latency to reach 90% of the response peak (mean ± s.e.m. across all blocks of trials; see Supplementary Methods). (e) PN responses have a faster decay from peak to half-peak. (f) A larger percentage of the total spike count occurs in the first 200 ms after odor onset for PN responses as compared to ORN responses.
Figure 3
Figure 3. ORNs and PNs differ in their odor selectivity
(a) Response profiles for 7 ORN types (green) and 7 PN types (magenta) corresponding to the same glomeruli. Bars show averages across all experiments (± s.e.m., see Supplementary Table 2 for n). Responses are measured as the mean spike rate during the 100-ms epoch when firing rates are peaking (black bar in Fig. 1b-d), minus baseline firing rate. Results are similar over the entire 500-ms stimulus period (Supplementary Fig. 3). (b) The selectivity of each response profile is quantified as lifetime sparseness, (see Supplementary Methods; 0 = non-selective, 1 = maximally selective). ORNs and PNs corresponding to the same glomeruli are connected. PNs are consistently less selective than their corresponding ORNs. The highest ORN sparseness value is for glomerulus DL1, and the lowest is for glomerulus VM2.
Figure 4
Figure 4. ORNs and PNs differ in their odor selectivity even at low stimulus intensities
(a) Response profiles for DM4 ORNs and PNs to a panel of 11 odors at 3 different concentrations. Bars show averages across all experiments (± s.e.m., see Supplementary Table 3 for n). Because the response peak tended to occur later for more dilute stimuli, we here measured responses as mean spike rate during the entire 500-ms stimulus period, minus baseline firing rate (as in Supplementary Fig. 3). (b) The selectivity of each response profile for the 3 different odor dilutions. ORNs and PNs corresponding to the same dilution are connected. Note that DM4 PNs are consistently less selective than DM4 ORNs at all three concentrations. (Selectivity at the 1:1000 dilution is slightly different than the selectivity value plotted in Supplementary Fig. 3 for this glomerulus because here we used only a subset of our 18 test odors.)
Figure 5
Figure 5. The rank order of ORN and PN odor preferences is different
(a) An example illustrating how we computed correlations between the odor ranks of individual cell response profiles. Here we show the mean and SD of the ORN and PN response profiles for glomerulus DM4. (Note the table is truncated after 6 odors.) We drew randomly from these distributions to produce representative simulated profiles for 2 individual ORNs and 2 individual PNs (arrows). Next we ranked the odors in each individual response profile (blue). In this example, the correlation coefficient between the 18 odor ranks of ORN sample 1 and ORN sample 2 (rs) is 0.79. Correlation coefficients are somewhat lower for PN/PN comparisons (0.58 in this example). By comparison with either of these, ORN/PN correlations are much lower (0.33, 0.39, 0.42, and 0.46 in this particular example). (b) Histograms showing the distribution of Spearman’s rank correlation coefficients (rs), accumulated across 2000 runs of the simulation procedure for each glomerulus. Arrowheads indicate median of each distribution. The ORN/PN correlations (gray) do not lie between the ORN/ORN (green) and PN/PN (magenta) correlations, indicating that ORN and PN odor ranks are not drawn from the same underlying mean distribution.
Figure 6
Figure 6. PN odor responses are partly explained by a highly nonlinear transformation of their direct ORN inputs
(a) For each glomerulus, average PN response to an odor is plotted versus the average ORN response to that odor (black symbols, ± s.e.m.). Curves are exponential fits (y=y0+A·ekx). Green and magenta symbols are projections of the data onto the x- and y-axes, showing that odor responses generally occupy a PN’s dynamic range more evenly than they occupy an ORN’s dynamic range. Responses are measured as the mean spike rate during the 100-ms epoch when firing rates are peaking (with no baseline subtraction), but results are similar if responses are measured as the mean spike rate during the entire 500-ms stimulus period (see Supplementary Fig. 5). (b) Histograms of ORN and PN response magnitudes. Each histogram is accumulated across all 126 response magnitudes (= 7 glomeruli ×18 odors). The PN histogram is flatter than the ORN histogram, indicating that PNs use their dynamic range more efficiently.
Figure 7
Figure 7. Odors are distributed more uniformly in ensemble PN coding space than in ensemble ORN coding space
(a) Average odor responses from 7 ORN types projected onto the space defined by the first two principal components. Each point represents a different odor. (b) Same as (a) for PN data (with the same color conventions), showing a more uniform separation between odor representations. (c) The difference between ensemble ORN responses to different odors is quantified as the Euclidean distance between odor representations in 7-dimensional space. Distances are computed for all 153 pairwise combinations of the 18 odor stimuli, and the median and interquartile range of this distribution are plotted here for each time point. The wide interquartile range means that some odors are well-separated in ORN space, but many are very poorly separated. Blue bands indicate the range of results obtained by shuffling odor labels on each glomerular response profile (see Supplementary Methods). (d) Same as (c) for PN responses. At the peak of the response (black bar), distances are significantly larger in PN space as compared to ORN space. PN responses then quickly accommodate (see Fig. 2), and so inter-odor distances shrink. However, the interquartile range of distances remains smaller than in ORN space. This indicates a more uniform distribution of distances. As in (c), shuffling odor labels on each glomerular response profile produces a range of results (blue bands) that resembles the real data.
Figure 8
Figure 8. Correlations between different glomeruli are similar for ORNs and PNs
(a) Principal components analysis (PCA) was applied to the 18×7 ORN response matrix. The magnitude of the variance accounted for by each PC (green circles) is a measure of the correlations between different ORN types. Blue bands indicate the range of results obtained by shuffling odor labels on each glomerular response profile (see Supplementary Methods). Comparison between data and simulation shows that ORNs are less independent in their odor responses than we would expect based simply on the distribution of response magnitudes within each glomerular coding channel. (b) Same as (a) for the 18×7 PN response matrix. Correlations between PN types are similar to correlations between ORN types.
Figure 9
Figure 9. A linear discriminator can classify odors more accurately with responses from multiple PNs than with responses from the same number of ORNs
(a) LDA odor classification success rate with data sets that include cells from 3 glomerular classes. All possible combinations of three glomeruli were sampled. Points are mean ± s.e.m., averaged across 20 runs of the classification procedure. Dotted line is chance performance. (b) Success rate is higher for PN data than for ORN data, regardless of how many glomerular classes are included in the data set. Points are mean ± s.e.m., averaged over the 100-ms window shown in (a), and then averaged across 20 runs of the classification procedure. Dashed green and magenta lines plot the classification success rate during the baseline period prior to odor onset; this is an artifact of varying spontaneous activity rates (see text), and ORN and PN performance is similar. Dotted black lines indicate perfect and chance performance.

Comment in

References

    1. Bargmann CI. Comparative chemosensation from receptors to ecology. Nature. 2006;444:295–301. - PubMed
    1. Mombaerts P. Genes and ligands for odorant, vomeronasal and taste receptors. Nat Rev Neurosci. 2004;5:263–78. - PubMed
    1. Laissue PP, et al. Three-dimensional reconstruction of the antennal lobe in Drosophila melanogaster. J Comp Neurol. 1999;405:543–52. - PubMed
    1. Hallem EA, Carlson JR. The odor coding system of Drosophila. Trends Genet. 2004;20:453–9. - PubMed
    1. Couto A, Alenius M, Dickson BJ. Molecular, anatomical, and functional organization of the Drosophila olfactory system. Curr Biol. 2005;15:1535–47. - PubMed

Publication types