. 2007 Nov;14(11):1089-95.
doi: 10.1038/nsmb1311. Epub 2007 Oct 7.

Conformational dynamics of the KcsA potassium channel governs gating properties

Affiliations

Conformational dynamics of the KcsA potassium channel governs gating properties

Kent A Baker et al. Nat Struct Mol Biol. 2007 Nov.

Abstract

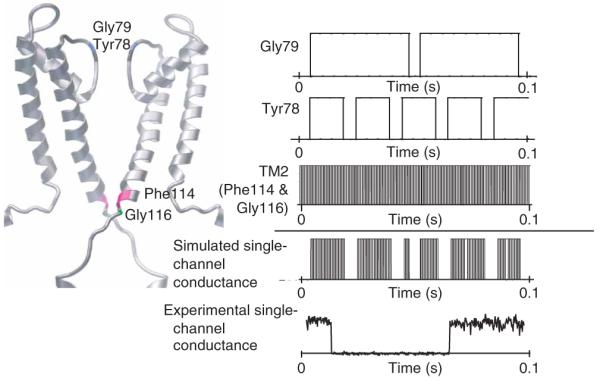
K+ channels conduct and regulate K+ flux across the cell membrane. Several crystal structures and biophysical studies of tetrameric ion channels have revealed many of the structural details of ion selectivity and gating. A narrow pore lined with four arrays of carbonyl groups is responsible for ion selectivity, whereas a conformational change of the four inner transmembrane helices (TM2) is involved in gating. We used NMR to examine full-length KcsA, a prototypical K+ channel, in its open, closed and intermediate states. These studies reveal that at least two conformational states exist both in the selectivity filter and near the C-terminal ends of the TM2 helices. In the ion-conducting open state, we observed rapid structural exchange between two conformations of the filter, presumably of low and high K+ affinity, respectively. Such measurements of millisecond-timescale dynamics reveal the basis for simultaneous ion selection and gating.


Figures

Figure 1
Figure 1
Secondary structure of KcsA(tox) in the closed and open conformations. (a,b) Deviations of the 13Cα chemical shifts from corresponding random-coil chemical shifts at pH 7 (closed conformation; a) and pH 4 (open conformation; b). Values larger than 1.5 p.p.m. are indicative of α-helical secondary structure, denoted by underline below panel c. Inset in a shows the 1HN chemical shifts of the N-terminal helix. The wave pattern is indicative of an amphipathic helix. (c) Difference of the 13Cα chemical shifts between the open and closed conformations. On the basis of these data, we identified structural changes between the closed and open conformations at the C terminus of TM2 and in the cytoplasmic C-terminal helix. Below, primary sequence of KcsA with α-helices underlined.
Figure 2
Figure 2
Correlation between functional and structural data for KcsA. (a) Residues Tyr78 (black), Gly79 (blue), Phe114 (purple) and Gly116 (green), for which pH-dependent chemical shifts correlated with functional data, are highlighted on the three-dimensional model of KcsA. (b) Relative chemical shift changes (left y-axis) of Tyr78 (black triangles), Gly79 (blue squares), Phe114 (purple diamonds) and Gly116 (green circles) of KcsA(tox) are plotted against pH. Superimposed is the open probability of KcsA (right y-axis) plotted against pH (black line), as measured in another study. The absolute pH-dependent 15N chemical shift changes of the residues are given in Supplementary Table 3. (c) Chemical shift change versus pH for Tyr78 of wild-type KcsA and indicated variants. (d) Relative open probabilities of KcsA, KcsA(tox) and KcsA(E71A), calculated from the relative chemical shift differences of Tyr78 between pH 7 and pH 4 assuming a model with two states between the open (pH 4) and closed (pH 7) conformations. The relative chemical shift differences are shown as percentages of the value for the open conformation.
Figure 3
Figure 3
Conformational difference in the backbone angle φ of Tyr78 between the conducting (pH 4) and nonconducting (pH 7) conformations of KcsA(tox). (a) The backbone angle φ of Tyr78 at pH 4 in the presence of K+ and at pH 7 in the presence or absence of K+, as calculated from 3J(1HN,1Hα) scalar coupling measurements using the Karplus relationship (represented by curve). Dotted lines mark the φ-angles of Tyr78 in the crystal structures of KcsA in the presence of low K+ (cyan) and high K+ (blue), and in the crystal structure of KcsA(E71A) in the alternative open conformation (orange). The relationship between 3J(1HN,1Hα) scalar coupling and the φ-angle of Tyr45 is shown for comparison; in all the crystal structures, Tyr45 is in a helical conformation with φ ≈ −60°. Red circle indicates a scaled scalar coupling at pH 4, which takes into account that Tyr78 of KcsA(tox) is in the low-affinity state with a probability of only 75% (see Fig. 2). The experiments were repeated at least three times. Error bars show s.d. Below, three-dimensional representations of the variations in Tyr78 angles at pH 7 and pH 4, from crystal structures at low and high K+ concentrations. K+ is shown as a pink sphere coordinated by the filter oxygens of Gly77 (red). Tyr78 backbone is in green.
Figure 4
Figure 4
pH titration of 15N-Tyr–labeled KcsA(tox) in the presence of K+, and KcsA(E71A) in the absence of K+. (a,b) The cross-peaks of Tyr78 of KcsA(tox) (a) and KcsA(E71A) (b) in the 15N-1H TROSY spectra are shown at different pHs, both as two-dimensional representations and in cross-sections. In cross-sections, the line-broadening effect of conformational exchange is indicated. In b, the two filter conformations from the crystal structures of KcsA(E71A) are shown. Question marks connecting these conformations with the NMR peak doubling denote that there is no direct information available as to whether the peak doubling originates from the same structural plurality observed in the crystals.
Figure 5
Figure 5
Channel conductance modeled on the basis of different exchange rates of the filter residues and the C terminus of TM2. The conformational exchange rates of Gly79, Tyr78 and the C terminus of TM2 are translated into a step function comprising two states, 0 for a locally nonpermeable state and 1 for a locally permeable state. Under the assumption that local conformational exchanges are independent of one another, the channel conductance can be modeled by multiplying the three step functions shown below. It is likely that there are additional conformational exchanges between locally nonpermeable and permeable states at the filter residues Thr-Thr-Val, which would substantially further influence the final channel conductance profile. The modeled channel conductance is compared with the experimentally measured single-channel conductance of KcsA(R64A) in symmetric KCl (200 mM KCl, pH 4.0, +150 mV). This experimental data was kindly provided by E. Perozo (University of Chicago) and is similar to the channel conductance measured in another study.

References

    1. Hille B. Ion Channels of Excitable Membranes. 3rd edn Sinauder, Sunderland; Massachusetts, USA: 2001.
    1. Doyle DA, et al. The structure of the potassium channel: molecular basis of K+ conduction and selectivity. Science. 1998;280:69–77. - PubMed
    1. Jiang Y, et al. Crystal structure and mechanism of a calcium-gated potassium channel. Nature. 2002;417:515–522. - PubMed
    1. Kuo A, et al. Crystal structure of the potassium channel KirBac1.1 in the closed state. Science. 2003;300:1922–1926. - PubMed
    1. Jiang Y, et al. X-ray structure of a voltage-dependent K+ channel. Nature. 2003;423:33–41. - PubMed

Publication types

MeSH terms

LinkOut - more resources