. 2007 Nov;31(7):659-71.
doi: 10.1002/gepi.20185.

Understanding the accuracy of statistical haplotype inference with sequence data of known phase

Affiliations

Understanding the accuracy of statistical haplotype inference with sequence data of known phase

Aida M Andrés et al. Genet Epidemiol. 2007 Nov.

Abstract

Statistical methods for haplotype inference from multi-site genotypes of unrelated individuals have important application in association studies and population genetics. Understanding the factors that affect the accuracy of this inference is important, but their assessment has been restricted by the limited availability of biological data with known phase. We created hybrid cell lines monosomic for human chromosome 19 and produced single-chromosome complete sequences of a 48 kb genomic region in 39 individuals of African American (AA) and European American (EA) origin. We employ these phase-known genotypes and coalescent simulations to assess the accuracy of statistical haplotype reconstruction by several algorithms. Accuracy of phase inference was considerably low in our biological data even for regions as short as 25-50 kb, suggesting that caution is needed when analyzing reconstructed haplotypes. Moreover, the reliability of estimated confidence in phase inference is not high enough to allow for a reliable incorporation of site-specific uncertainty information in subsequent analyses. We show that, in samples of certain mixed ancestry (AA and EA populations), the most accurate haplotypes are probably obtained when increasing sample size by considering the largest, pooled sample, despite the hypothetical problems associated with pooling across those heterogeneous samples. Strategies to improve confidence in reconstructed haplotypes, and realistic alternatives to the analysis of inferred haplotypes, are discussed.


Figures
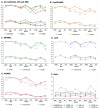
Fig. 1
Fig. 1
(A) Comparison of the Haplotype error rate (upper) and SS error rate (lower) of datasets containing all SS, for the four programs. X-axis: dataset; Y-axis: error rate. Similar plots are obtained when considering common SS or tag SS datasets. (B, C, D, E) Haplotype error rate (upper lines) and SS error rate (lower lines) of datasets containing all SS, common SS, or tag SS, for the three programs (fastPHASE [B], GERBIL [C], HAP [D], PHASE [E]). Axes as in (A). (F) Switch Error Rate of datasets containing common SS or tagSS, for the four different programs. Axes as in (A).
Fig. 2
Fig. 2
(A) Haplotype error rate (upper) and SS error rate (lower) of haplotype reconstruction with PHASE 2.1 for simulated datasets of different sample sizes and population structure. X-axis: number of individuals in the sample; Y-axis: error rate. KLK13_AA: sample containing X individuals from African-American (AA) origin; KLK13_EA: sample containing X individuals from European-American (EA) origin; KLK13: sample containing X individuals from both populations (X/2(AA)+X/2 (EA)); KLK13comb: sample containing 2X individuals, X(AA)+X(EA). The contrast of this last category with KLK13_AA and KLK13_EA illustrates the effect of phasing all individuals as a single sample, as opposed to reconstructing haplotypes separately by population. Note that points with white background (size 39 for KLK13, and size 20 for _AA and _EA) correspond to the error of the single best PHASE run on the original dataset. The rest of points correspond to the average error when phasing 50 pseudodatasets of the corresponding size. (B and C) Haplotype error (Y-axis) for coalescent simulations performed under the equilibrium (B) or demographic (C) models with different recombination rates (X-axis). Results are shown for different lengths of the segment (here indicated as number of SS), considering all SS or common SS. All haplotype reconstruction was performed with PHASE 2.1. The two graphs are not directly comparable due to inequality of population structure, long-range Ne, and ρ differences (see Materials and Methods).
Fig. 3
Fig. 3
Frequency of PHASE estimated confidence for a given site (probability of the site, see PHASE 2.1 documentation) for correctly and incorrectly assigned sites. X-axis: estimated confidence of the algorithm to individual sites (the probability of the site). Probability ranges from 0.5 to 1. Y-axes: relative frequency. Dark gray represents sites correctly assigned to haplotype (performance = 1) and light gray represents sites incorrectly assigned to haplotype (performance = 0). All values were calculated considering the information of three runs of the program for every dataset.

Similar articles

Cited by

References

    1. Barrett JC, Fry B, Maller J, Daly MJ, Barrett JC, Fry B, Maller J, Daly MJ. Haploview: analysis and visualization of LD and haplotype maps. Bioinformatics. 2005;21:263–265. - PubMed
    1. Carlson CS, Eberle MA, Rieder MJ, Yi Q, Kruglyak L, Nickerson DA. Selecting a maximally informative set of single-nucleotide polymorphisms for association analysis using linkage disequilibrium. Am J Hum Genet. 2004;74:106–120. - PMC - PubMed
    1. Chung RH, Gusfield D. Perfect phylogeny haplotyper: haplotype inferral using a tree model. Bioinformatics. 2003;19:780–781. - PubMed
    1. Clark AG. Inference of haplotypes from PCR-amplified samples of diploid populations. Mol Biol Evol. 1990;7:111–122. - PubMed
    1. Clark AG. The role of haplotypes in candidate gene studies. Genet Epidemiol. 2004;27:321–333. - PubMed

Publication types