

Power to detect risk alleles using genome-wide tag SNP panels
- PMID: 17922574
- PMCID: PMC2000969
- DOI: 10.1371/journal.pgen.0030170
Power to detect risk alleles using genome-wide tag SNP panels
Abstract
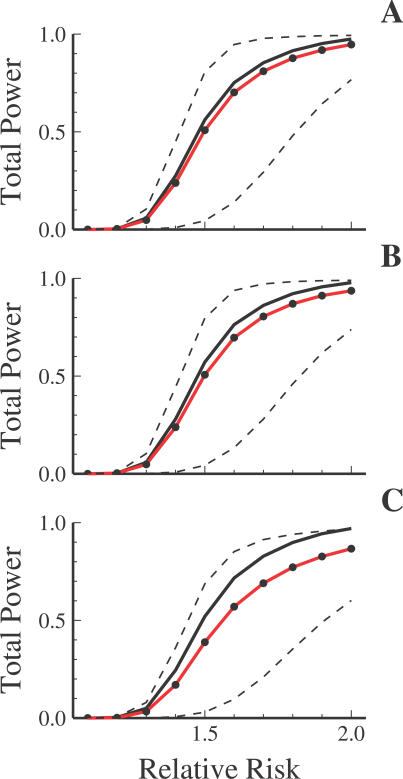
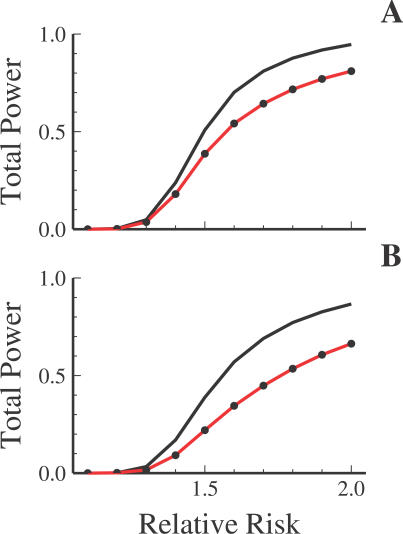
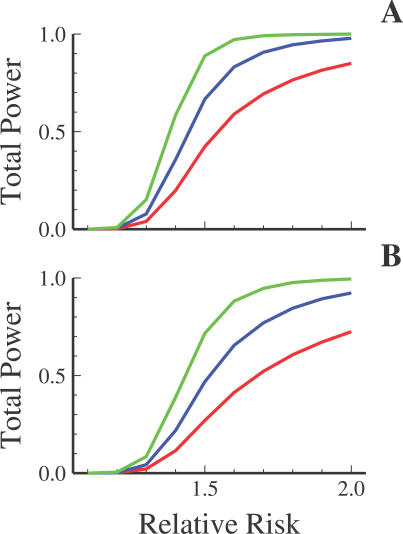
Advances in high-throughput genotyping and the International HapMap Project have enabled association studies at the whole-genome level. We have constructed whole-genome genotyping panels of over 550,000 (HumanHap550) and 650,000 (HumanHap650Y) SNP loci by choosing tag SNPs from all populations genotyped by the International HapMap Project. These panels also contain additional SNP content in regions that have historically been overrepresented in diseases, such as nonsynonymous sites, the MHC region, copy number variant regions and mitochondrial DNA. We estimate that the tag SNP loci in these panels cover the majority of all common variation in the genome as measured by coverage of both all common HapMap SNPs and an independent set of SNPs derived from complete resequencing of genes obtained from SeattleSNPs. We also estimate that, given a sample size of 1,000 cases and 1,000 controls, these panels have the power to detect single disease loci of moderate risk (lambda approximately 1.8-2.0). Relative risks as low as lambda approximately 1.1-1.3 can be detected using 10,000 cases and 10,000 controls depending on the sample population and disease model. If multiple loci are involved, the power increases significantly to detect at least one locus such that relative risks 20%-35% lower can be detected with 80% power if between two and four independent loci are involved. Although our SNP selection was based on HapMap data, which is a subset of all common SNPs, these panels effectively capture the majority of all common variation and provide high power to detect risk alleles that are not represented in the HapMap data.
Conflict of interest statement
Competing interests. MAE, KK, DAP, KLG, RS, LG, KAVM, and CTL are employed by the company that makes the array chips analyzed. PCN, LZ, and SSM are former employees.
Figures


References
-
- Botstein D, Risch N. Discovering genotypes underlying human phenotypes: past successes for mendelian disease, future approaches for complex disease. Nat Genet. 2003;33(Suppl):228–237. - PubMed
-
- Collins FS, Guyer MS, Charkravarti A. Variations on a theme: cataloging human DNA sequence variation. Science. 1997;278:1580–1581. - PubMed
-
- Kruglyak L. Prospects for whole-genome LD mapping of common disease genes. Nat Genet. 1999;22:139–144. - PubMed
-
- de Bakker PI, Yelensky R, Pe'er I, Gabriel SB, Daly MJ, et al. Efficiency and power in genetic association studies. Nat Genet. 2005;37:1217–1223. - PubMed
-
- Hirschhorn JN, Daly MJ. Genome-wide association studies for common diseases and complex traits. Nat Rev Genet. 2005;6:95–108. - PubMed
MeSH terms
LinkOut - more resources
Full Text Sources
Other Literature Sources
Research Materials
