Structural disorder promotes assembly of protein complexes
- PMID: 17922903
- PMCID: PMC2194777
- DOI: 10.1186/1472-6807-7-65
Structural disorder promotes assembly of protein complexes
Abstract
Background: The idea that the assembly of protein complexes is linked with protein disorder has been inferred from a few large complexes, such as the viral capsid or bacterial flagellar system, only. The relationship, which suggests that larger complexes have more disorder, has never been systematically tested. The recent high-throughput analyses of protein-protein interactions and protein complexes in the cell generated data that enable to address this issue by bioinformatic means.
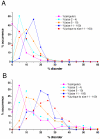
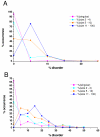
Results: In this work we predicted structural disorder for both E. coli and S. cerevisiae, and correlated it with the size of complexes. Using IUPred to predict the disorder for each complex, we found a statistically significant correlation between disorder and the number of proteins assembled into complexes. The distribution of disorder has a median value of 10% in yeast for complexes of 2-4 components (6% in E. coli), but 18% for complexes in the size range of 11-100 proteins (12% in E. coli). The level of disorder as assessed for regions longer than 30 consecutive disordered residues shows an even stronger division between small and large complexes (median values about 4% for complexes of 2-4 components, but 12% for complexes of 11-100 components in yeast). The predicted correlation is also supported by experimental evidence, by observing the structural disorder in protein components of complexes that can be found in the Protein Data Bank (median values 1. 5% for complexes of 2-4 components, and 9.6% for complexes of 11-100 components in yeast). Further analysis shows that this correlation is not directly linked with the increased disorder in hub proteins, but reflects a genuine systemic property of the proteins that make up the complexes.
Conclusion: Overall, it is suggested and discussed that the assembly of protein-protein complexes is enabled and probably promoted by protein disorder.
Figures


Similar articles
-
Prevalent structural disorder in E. coli and S. cerevisiae proteomes.J Proteome Res. 2006 Aug;5(8):1996-2000. doi: 10.1021/pr0600881. J Proteome Res. 2006. PMID: 16889422
-
Protein-protein Interaction Networks of E. coli and S. cerevisiae are similar.Sci Rep. 2014 Nov 28;4:7187. doi: 10.1038/srep07187. Sci Rep. 2014. PMID: 25431098 Free PMC article.
-
Structural analysis of the interactions between hsp70 chaperones and the yeast DNA replication protein Orc4p.J Mol Biol. 2010 Oct 15;403(1):24-39. doi: 10.1016/j.jmb.2010.08.022. Epub 2010 Aug 21. J Mol Biol. 2010. PMID: 20732327
-
Chaperone-assisted protein aggregate reactivation: Different solutions for the same problem.Arch Biochem Biophys. 2015 Aug 15;580:121-34. doi: 10.1016/j.abb.2015.07.006. Epub 2015 Jul 6. Arch Biochem Biophys. 2015. PMID: 26159839 Review.
-
Rotational catalysis in proton pumping ATPases: from E. coli F-ATPase to mammalian V-ATPase.Biochim Biophys Acta. 2012 Oct;1817(10):1711-21. doi: 10.1016/j.bbabio.2012.03.015. Epub 2012 Mar 20. Biochim Biophys Acta. 2012. PMID: 22459334 Review.
Cited by
-
A flexible brace maintains the assembly of a hexameric replicative helicase during DNA unwinding.Nucleic Acids Res. 2012 Mar;40(5):2271-83. doi: 10.1093/nar/gkr906. Epub 2011 Nov 8. Nucleic Acids Res. 2012. PMID: 22067453 Free PMC article.
-
To be disordered or not to be disordered: is that still a question for proteins in the cell?Cell Mol Life Sci. 2017 Sep;74(17):3185-3204. doi: 10.1007/s00018-017-2561-6. Epub 2017 Jun 13. Cell Mol Life Sci. 2017. PMID: 28612216 Free PMC article. Review.
-
Dynamic Protein Interaction Networks and New Structural Paradigms in Signaling.Chem Rev. 2016 Jun 8;116(11):6424-62. doi: 10.1021/acs.chemrev.5b00548. Epub 2016 Feb 29. Chem Rev. 2016. PMID: 26922996 Free PMC article. Review.
-
Intrinsic protein disorder in human pathways.Mol Biosyst. 2012 Jan;8(1):320-6. doi: 10.1039/c1mb05274h. Epub 2011 Oct 20. Mol Biosyst. 2012. PMID: 22012032 Free PMC article.
-
Classification of intrinsically disordered regions and proteins.Chem Rev. 2014 Jul 9;114(13):6589-631. doi: 10.1021/cr400525m. Epub 2014 Apr 29. Chem Rev. 2014. PMID: 24773235 Free PMC article. Review. No abstract available.
References
Publication types
MeSH terms
Substances
Grants and funding
LinkOut - more resources
Full Text Sources
Molecular Biology Databases

