

MicroRNA expression profiling of human breast cancer identifies new markers of tumor subtype
- PMID: 17922911
- PMCID: PMC2246288
- DOI: 10.1186/gb-2007-8-10-r214
MicroRNA expression profiling of human breast cancer identifies new markers of tumor subtype
Abstract
Background: MicroRNAs (miRNAs), a class of short non-coding RNAs found in many plants and animals, often act post-transcriptionally to inhibit gene expression.
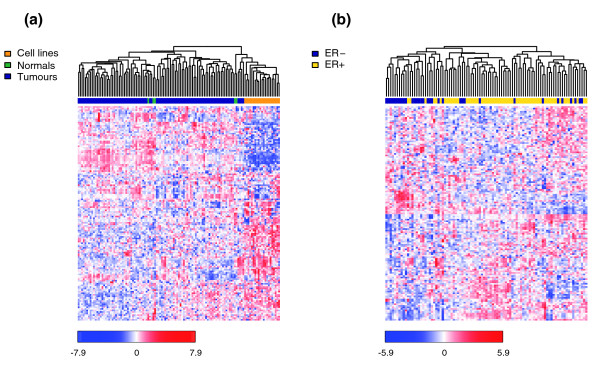
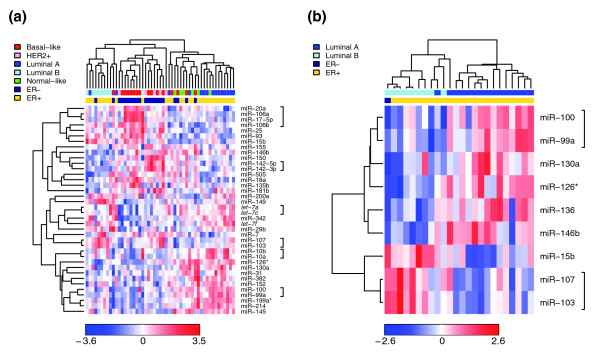
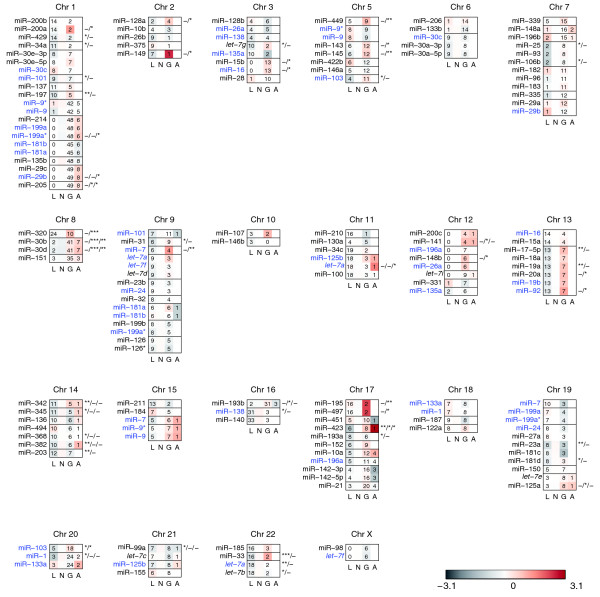
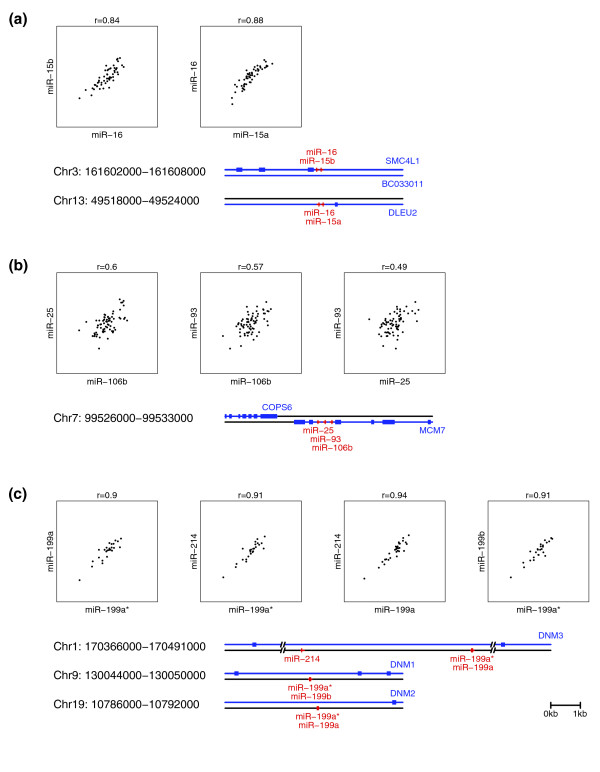
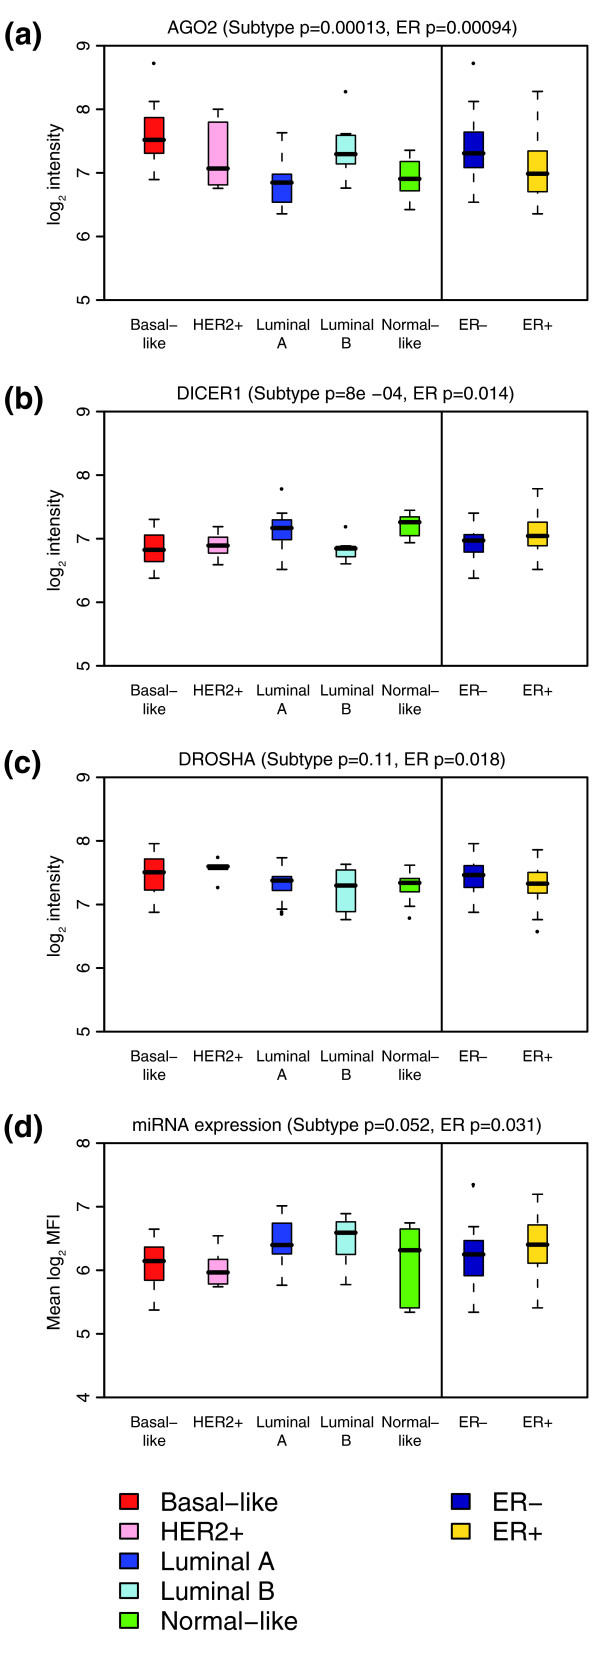
Results: Here we report the analysis of miRNA expression in 93 primary human breast tumors, using a bead-based flow cytometric miRNA expression profiling method. Of 309 human miRNAs assayed, we identify 133 miRNAs expressed in human breast and breast tumors. We used mRNA expression profiling to classify the breast tumors as luminal A, luminal B, basal-like, HER2+ and normal-like. A number of miRNAs are differentially expressed between these molecular tumor subtypes and individual miRNAs are associated with clinicopathological factors. Furthermore, we find that miRNAs could classify basal versus luminal tumor subtypes in an independent data set. In some cases, changes in miRNA expression correlate with genomic loss or gain; in others, changes in miRNA expression are likely due to changes in primary transcription and or miRNA biogenesis. Finally, the expression of DICER1 and AGO2 is correlated with tumor subtype and may explain some of the changes in miRNA expression observed.
Conclusion: This study represents the first integrated analysis of miRNA expression, mRNA expression and genomic changes in human breast cancer and may serve as a basis for functional studies of the role of miRNAs in the etiology of breast cancer. Furthermore, we demonstrate that bead-based flow cytometric miRNA expression profiling might be a suitable platform to classify breast cancer into prognostic molecular subtypes.
Figures

Similar articles
-
Integrated miRNA and mRNA expression profiling of mouse mammary tumor models identifies miRNA signatures associated with mammary tumor lineage.Genome Biol. 2011 Aug 16;12(8):R77. doi: 10.1186/gb-2011-12-8-r77. Genome Biol. 2011. PMID: 21846369 Free PMC article.
-
Comprehensive analysis of microRNA (miRNA) targets in breast cancer cells.J Biol Chem. 2013 Sep 20;288(38):27480-27493. doi: 10.1074/jbc.M113.491803. Epub 2013 Aug 6. J Biol Chem. 2013. PMID: 23921383 Free PMC article.
-
Integration of microRNA signatures of distinct mammary epithelial cell types with their gene expression and epigenetic portraits.Breast Cancer Res. 2015 Jun 18;17(1):85. doi: 10.1186/s13058-015-0585-0. Breast Cancer Res. 2015. PMID: 26080807 Free PMC article.
-
Regulation of microRNA biogenesis and function.Thromb Haemost. 2012 Apr;107(4):605-10. doi: 10.1160/TH11-12-0836. Epub 2012 Feb 8. Thromb Haemost. 2012. PMID: 22318703 Review.
-
MicroRNAs: A Link between Mammary Gland Development and Breast Cancer.Int J Mol Sci. 2022 Dec 15;23(24):15978. doi: 10.3390/ijms232415978. Int J Mol Sci. 2022. PMID: 36555616 Free PMC article. Review.
Cited by
-
Cell-free Circulating miRNA Biomarkers in Cancer.J Cancer. 2012;3:432-48. doi: 10.7150/jca.4919. Epub 2012 Oct 13. J Cancer. 2012. PMID: 23074383 Free PMC article.
-
The bioinformatics analysis of miRNAs signatures differentially expressed in HER2(+) versus HER2(-) breast cancers.Cancer Biother Radiopharm. 2013 Feb;28(1):71-6. doi: 10.1089/cbr.2012.1311. Epub 2012 Sep 25. Cancer Biother Radiopharm. 2013. PMID: 23009584 Free PMC article.
-
Expression and methylation patterns partition luminal-A breast tumors into distinct prognostic subgroups.Breast Cancer Res. 2016 Jul 7;18(1):74. doi: 10.1186/s13058-016-0724-2. Breast Cancer Res. 2016. PMID: 27386846 Free PMC article.
-
Cancer Hallmarks, Biomarkers and Breast Cancer Molecular Subtypes.J Cancer. 2016 Jun 23;7(10):1281-94. doi: 10.7150/jca.13141. eCollection 2016. J Cancer. 2016. PMID: 27390604 Free PMC article. Review.
-
Estrogen mediated-activation of miR-191/425 cluster modulates tumorigenicity of breast cancer cells depending on estrogen receptor status.PLoS Genet. 2013;9(3):e1003311. doi: 10.1371/journal.pgen.1003311. Epub 2013 Mar 7. PLoS Genet. 2013. PMID: 23505378 Free PMC article.
References
Publication types
MeSH terms
Substances
LinkOut - more resources
Full Text Sources
Other Literature Sources
Medical
Molecular Biology Databases
Research Materials
Miscellaneous
