. 2007 Oct 5;131(1):106-20.
doi: 10.1016/j.cell.2007.08.039.

Insights into Hsp70 chaperone activity from a crystal structure of the yeast Hsp110 Sse1

Affiliations

Insights into Hsp70 chaperone activity from a crystal structure of the yeast Hsp110 Sse1

Qinglian Liu et al. Cell. .

Abstract

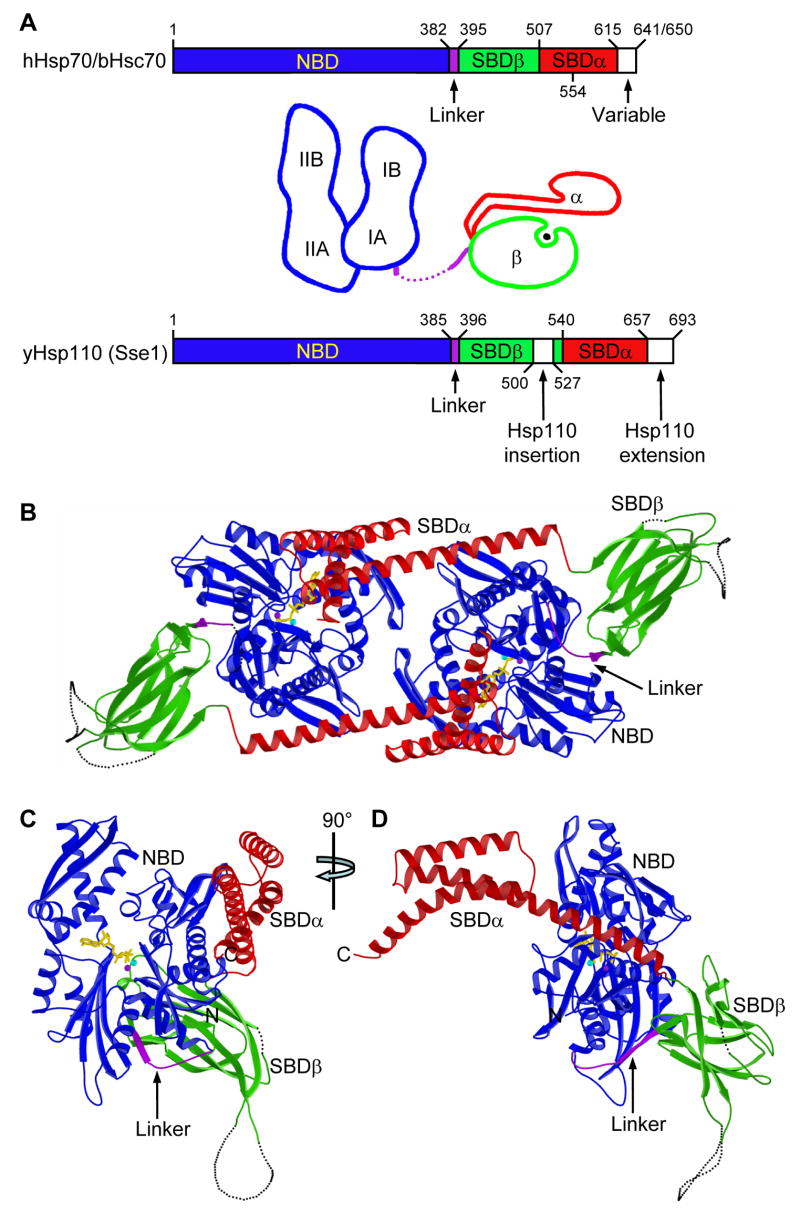
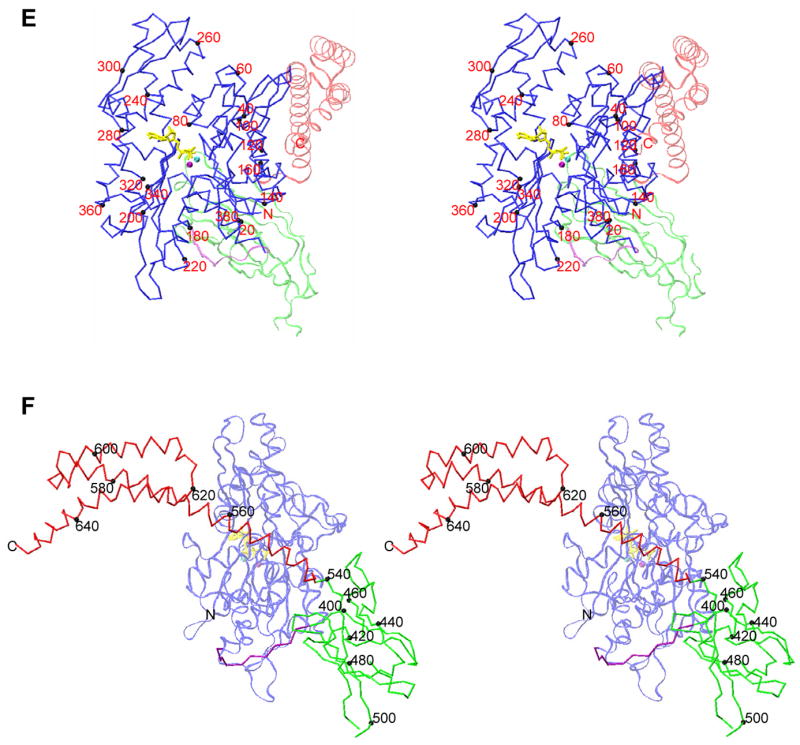
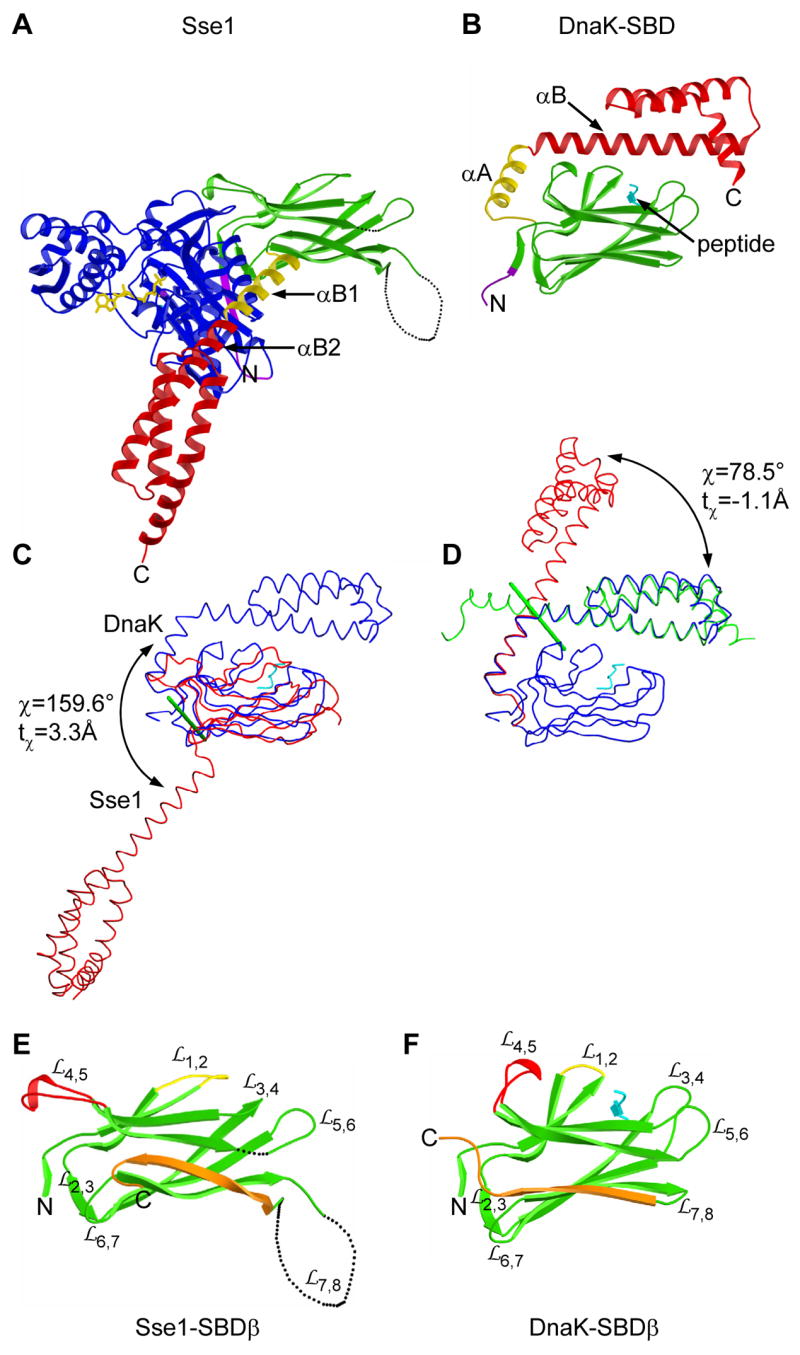
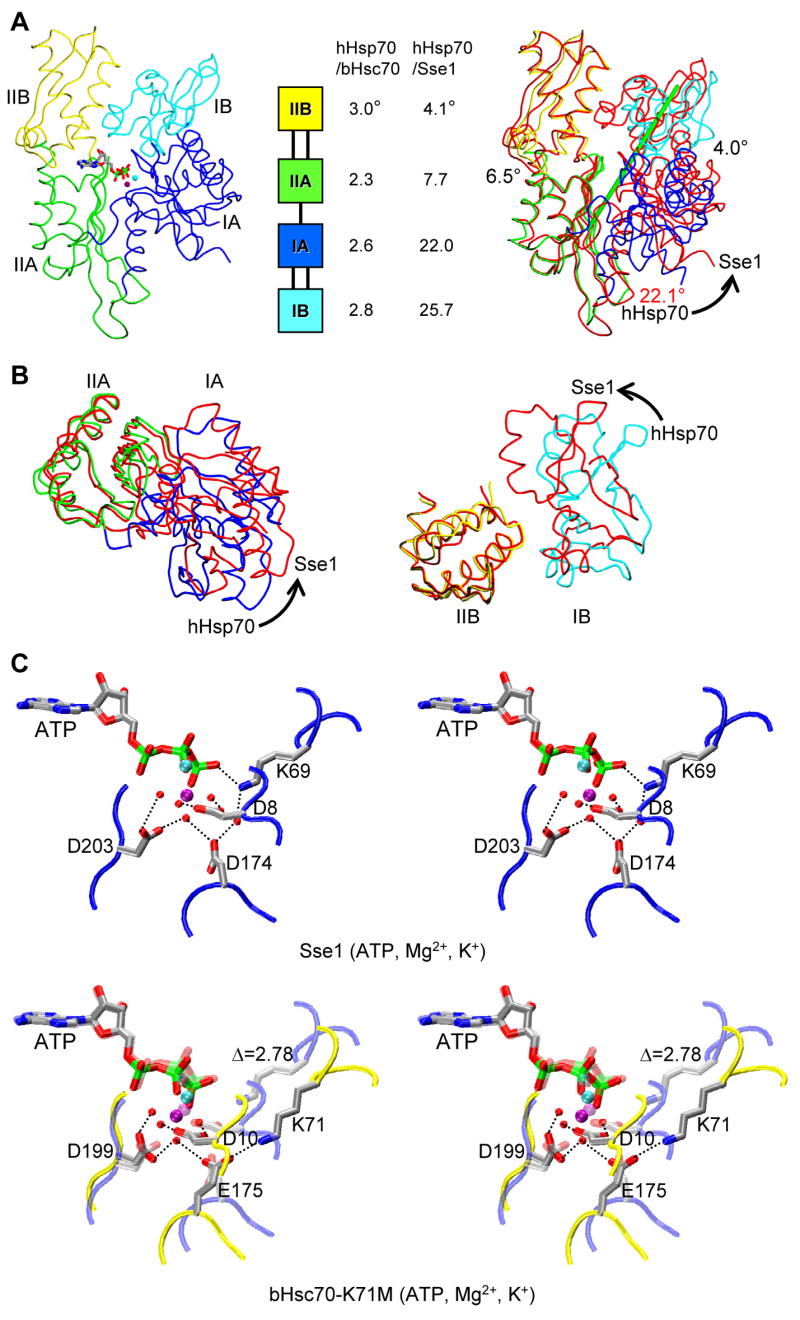
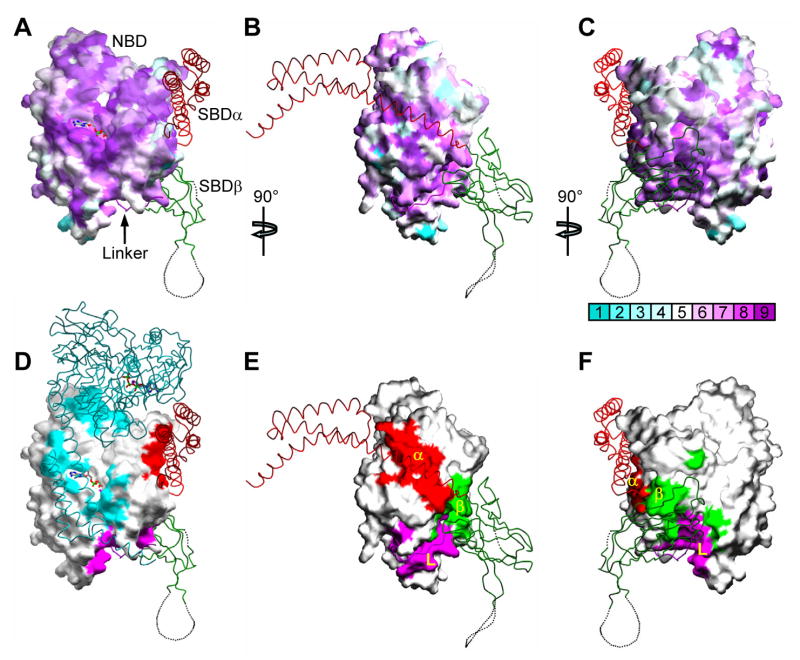
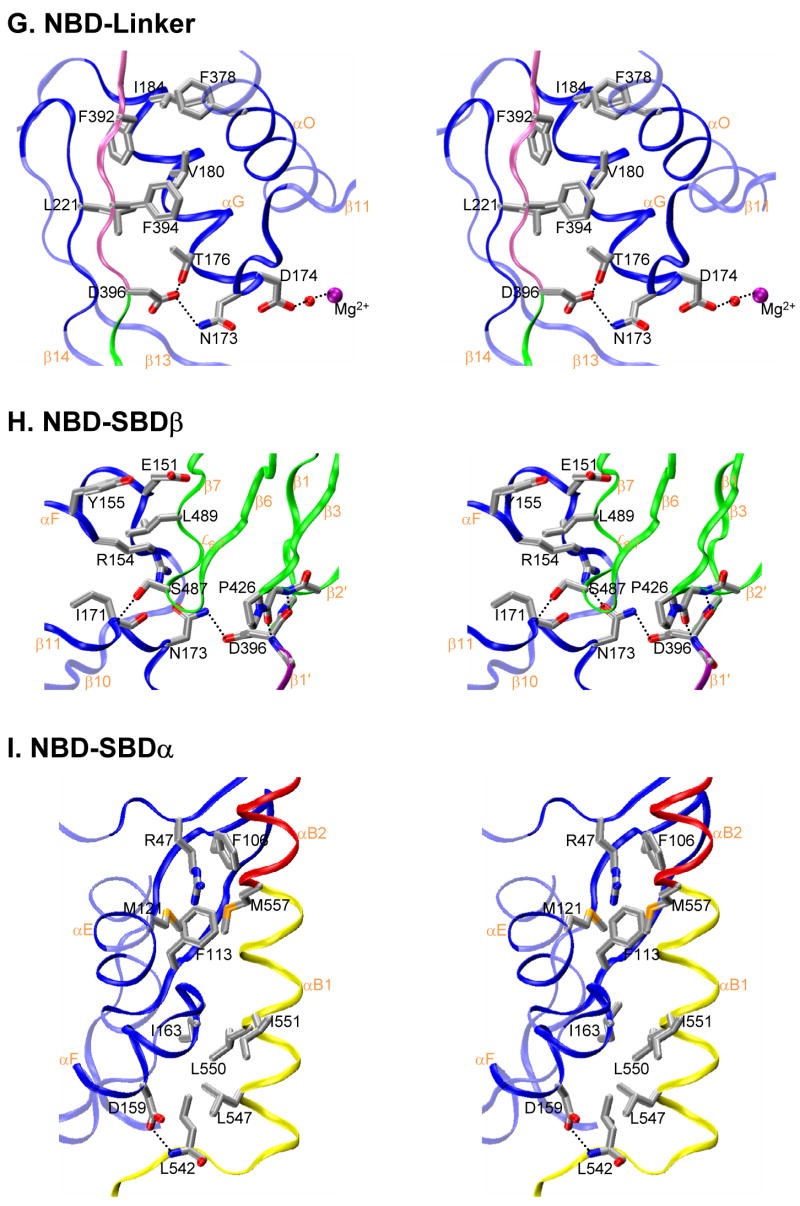
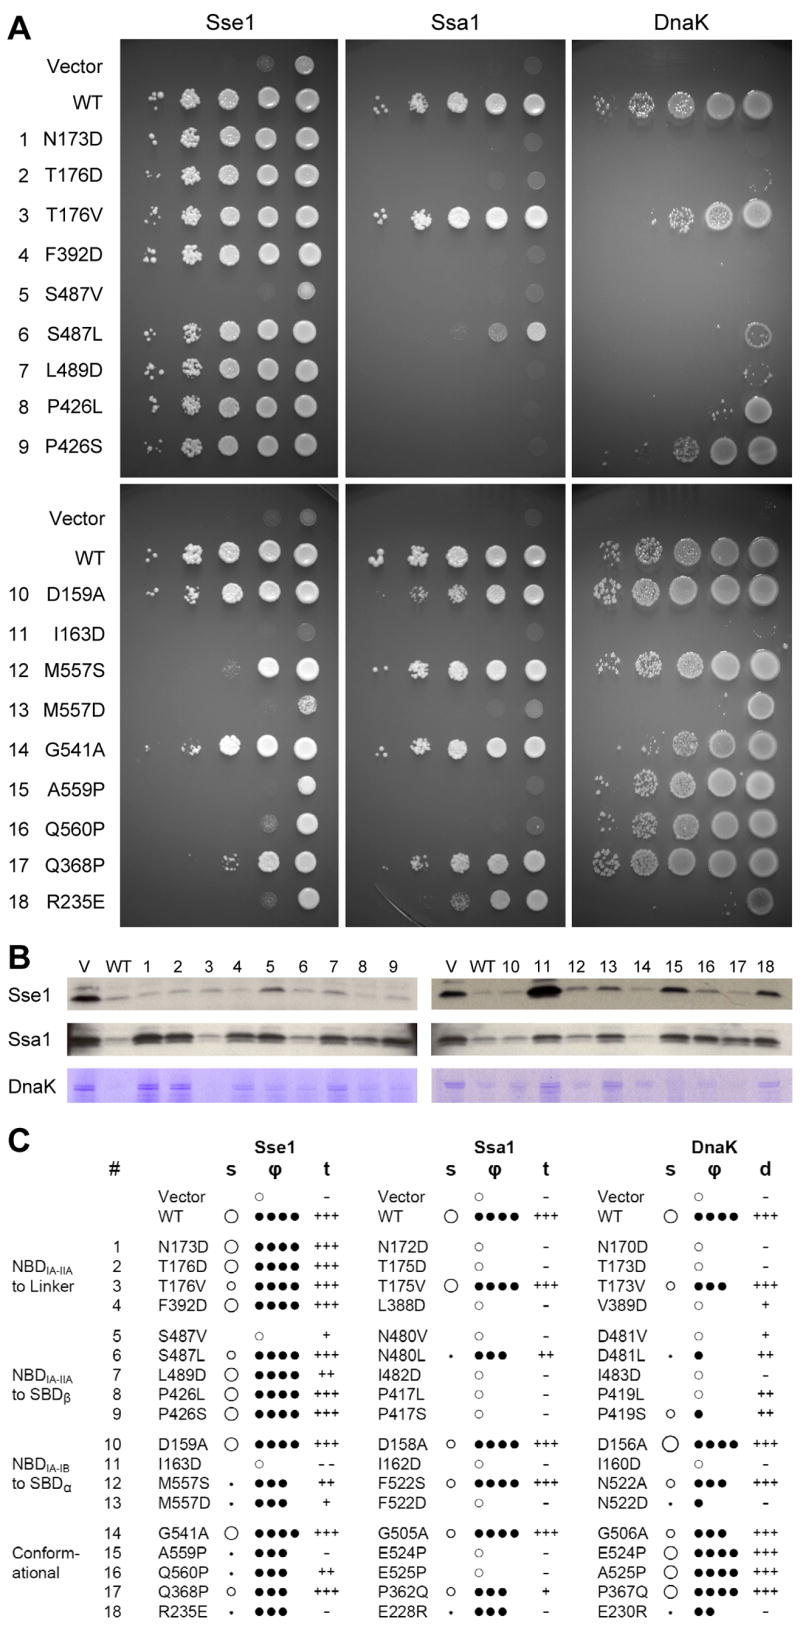
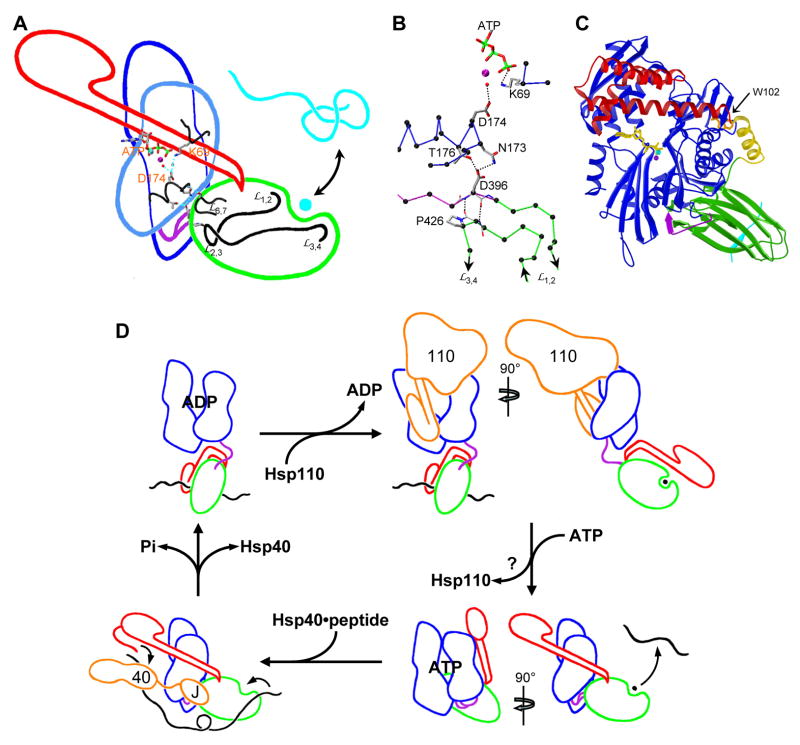
Classic Hsp70 chaperones assist in diverse processes of protein folding and translocation, and Hsp110s had seemed by sequence to be distant relatives within an Hsp70 superfamily. The 2.4 A resolution structure of Sse1 with ATP shows that Hsp110s are indeed Hsp70 relatives, and it provides insight into allosteric coupling between sites for ATP and polypeptide-substrate binding in Hsp70s. Subdomain structures are similar in intact Sse1(ATP) and in the separate Hsp70 domains, but conformational dispositions are radically different. Interfaces between Sse1 domains are extensive, intimate, and conservative in sequence with Hsp70s. We propose that Sse1(ATP) may be an evolutionary vestige of the Hsp70(ATP) state, and an analysis of 64 mutant variants in Sse1 and three Hsp70 homologs supports this hypothesis. An atomic-level understanding of Hsp70 communication between ATP and substrate-binding domains follows. Requirements on Sse1 for yeast viability are in keeping with the distinct function of Hsp110s as nucleotide exchange factors.


Figures

Figure 1
Figure 1. Overall structure of Sse1
(A) Schematics of Hsp70 and Hsp110 sequences and prototypic Hsp70 domain structures. Coloring is NBD (blue), interdomain linker (purple), SBDβ (green), SBDα (red). (B) Ribbon diagram of the dimer. Protomer A is left and B is right. Missing loops are dotted. Protein coloring is as in A. ATP molecules have sticks for bonds (yellow) and balls for associated metal ions: Mg2+ (purple) and K+ (cyan). (C) Ribbon diagram of protomer B in the canonical, front-face NBD view. (D) Orthogonal view of the protomer drawn as in C, but from the right side. (E) Stereo drawing of a Cα trace of protomer B. NBD is in stick representation (full intensity) and SBD is in a continuous fine ribbon (subdued). View and coloring are as in C. Every 20th NBD Cα is marked with a black sphere and labeled. (F) Stereo drawing as in E, but viewed and colored as in D except that now SBD is at full intensity and NBD is subdued.
Figure 2
Figure 2. Comparison of SBD conformations in Sse1 and DnaK
(A) Ribbon diagram of Sse1 drawn and colored as in 1B except that helix αB1 is now yellow. Orientation is after superposition of its SBDβ onto that of DnaK as in 2B. (B) Ribbon diagram of the DnaK SBD complexed with a heptapeptide (cyan). Linker and SBD coloring is as in A. (C) Superposition of SBD from Sse1 (red) with that of DnaK (blue) complexed with a heptapeptide (cyan) as based on SBDβ Cαs. Cα traces are oriented as in A and B. Rotation of α-subdomains is about the green rod. (D) Superposition of the DnaK SBD (blue) with SBDα from Sse1 as based on helix αA/αB1 (red) or helices αB/αC/αD/αE (green). Rotation is about the green rod. (E) Ribbon diagram of Sse1 SBDβ oriented as in A. Conformationally distinct features are highlighted: 1,2 (yellow), 4,5 (red), and β8 through β-α connector (orange). (F) Ribbon diagram of DnaK SBDβ oriented and colored as in E, adding the heptapeptide (cyan).
Figure 3
Figure 3. Comparison of NBD conformations in Sse1 and Hsp70s
(A) Cα traces of Sse1 (left) and Sse1 superimposed onto hHsp70 (right, based on Cαs in subdomain IIA), and relative domain orientations (middle, based on superpositions of adenine-ribose-Pα atoms). NBDs are oriented in the canonical, front-face view. Sse1 subdomains (left) and hHsp70 subdomains (right) are colored: IA (blue), IB (cyan), IIA (green) and IIB (yellow). Sse1 (right) is red. ATP is drawn and colored as in 3C. Rotation relating IA and IIA is about the green rod (right). (B) Superpositions of Sse1 and hHsp70 NBD subdomains viewed from above A, rotated 90° around the horizontal. Coloring is as in A (right). Superpositions of both IA/IIA (left) and IB/IIB (right) are based on Cαs in lobe II subdomains. (C) Stereodrawing of ATP catalytic sites in Sse1 (above) and bHsc70 (below). The view is changed slightly from 3A. Adenine-ribose-Pα atoms are superimposed. The image for bHsc70(ATP) is a composite from bHsc70(ATP, K71M) (PDB 1KAX) and side-chain atoms of Lys71 translated into Cα superposition from bHsc70(ATP, D199N) (PDB 1NGF); a subdued version of Sse1 is superimposed. Side chains are shown for four residues shown for bHsc70 to be most critical for ATPase function and for counterparts in Sse1. Coloring for ATP, ions and side chains has the pattern: carbon (grey), nitrogen (blue), oxygen (red), phosphorous (green), Mg2+ (purple) and K+ (cyan); backbone traces are bHsc70 (yellow) and Sse1 (red). Hydrogen bonds are drawn as black dotted lines.
Figure 4
Figure 4. Characteristics of interdomain interfaces
(A, B, C) Mapping of NBD sequence conservation onto the NBD surface from Sse1. Three orthogonal views are presented: (A) front view as in 1B, (B) side view as in 1C, and (C) back view, rotated 180° from A about the vertical axis. Sequence similarity is quantified from across the Hsp70 superfamily and mapped by ConSurf (http://consurf.tau.ac.il/) into colors of increasing purple intensity for conservation and increasing aqua intensity for variability (key under C), relative to average conservation (white). Cα traces are overlayed from SBD components color coded as linker (purple), SBDβ (green) and SBDα (red). (D, E, F) Mapping of NBD surfaces as buried into linker and SBD interfaces. Views are as in A, B and C, respectively. Surface imprints are shown colored: SBDα (red), SBDβ (green), interdomain linker (purple), and apposing protomer (cyan). Cα traces are overlayed as in A, B and C, adding the apposing protomer in cyan for D. (G, H, I) Stereodrawings of interdomain interfaces featuring residues targeted for mutagenesis. Main-chain ribbons are colored as in 1 and side-chain atoms are colored as in 3C. (G) NBD-linker interface. (H) NBD-SBDβ interface. (I) NBD-SBDα interface.
Figure 5
Figure 5. Mutational analysis
(A) Growth tests of mutant variants of Sse1, Ssa1 and DnaK. Expression plasmids mutated as indicated for Sse1, or homologously for Ssa1 or DnaK, were tested in appropriate null backgrounds. For each test, 10-fold serial dilutions (10−1 to 10−5) from overnight cultures were spotted (right to left) onto agar plates containing appropriate growth media. Plates were incubated at heat-stress temperatures of 40°C, 37°C, and 40°C, respectively. (B) Tests of specific heat-shock chaperone activities. Sse1 and Ssa1 panels test translocation activity, showing accumulation of unprocessed ppαF by Western blot analysis. DnaK panels test folding activity, showing residual aggregation of RNA polymerase β andβ ′ chains after heat shock and return to permissive temperature. Mutant variants (identified by numbers cited in A) are compared to vector (V) and wild type (WT) controls. (C). Phenotypic analyses of heat-stress responses. Mutant variants were analyzed microscopically for colony morphology (s) and culture viability (ϕ) in growth response at heat-stress temperatures. Colony morphology (s) is scored based primarily on size as larger than wild type (○), wild-type size (○), small (●), point-like (·) or not visible (blank). Culture viability (ϕ) is scored according to the fractions of colonies formed at 40°C or 37°C in comparison to those at 30°C: ϕ=100% (● ● ● ●), 10% ≤ϕ<100% (● ● ●),1%≤ϕ<10% (● ●),0%<ϕ<1% (●), 0% (●). Translocation activity (t) and disaggregation activity (d) are scored as wild type (+++), impaired (++), seriously impaired (+), vector control level (−), impaired beyond control (− −). Each phenotypic designation is based on at least three replicates of experiments such as those shown in A and B, together with associated controls.
Figure 6
Figure 6. Mechanistic implications
(A) Structural linkage between binding sites for ATP and polypeptide substrates. Outlines of structural subdomains from Sse1, oriented as in 1C, are superimposed with selected atomic details. Outlines are colored: NBD (blue), linker (purple), SBD β-subdomain (green), SBD α-subdomain (red), polypeptide substrate (cyan); sidechains and ATP are colored as in 3C. (B) Hydrogen-bonding details of the SBDβ-linker-NBD interface. The view is as in 6A but rotated clockwise by ~40°. Cα atoms are black; other coloring is as in 6A. (C) Homology model of DnaK(ATP) based on the Sse1 template. The ribbon diagram is oriented and colored as for Sse1 in 1B. Trp102 is colored orange. (D) Schematic for the Hsp70 chaperone cycle in the eukaryotic cytosol. Component outlines are based on structures discussed in the text. Coloring is as in 1A and 6A, but with polypeptide substrates in black and Hsp40 and Hsp110 components in orange. Hsp110 is drawn in the Sse1(ATP) conformation. It is not clear where Hsp110 preferentially leaves the cycle as it may participate at multiple stages.

References

    1. Becker J, Walter W, Yan W, Craig EA. Functional interaction of cytosolic Hsp70 and a DnaJ-related protein, Ydj1p, in protein translocation in vivo. Mol Cell Biol. 1996;16:4378–4386. - PMC - PubMed
    1. Buchberger A, Theyssen H, Schroder H, McCarty JS, Virgallita G, Milkereit P, Reinstein J, Bukau B. Nucleotide-induced conformational changes in the ATPase and substrate binding domains of the DnaK chaperone provide evidence for interdomain communication. J Biol Chem. 1995;270:16903–16910. - PubMed
    1. Burkholder WF, Zhao X, Zhu X, Hendrickson WA, Gragerov A, Gottesman ME. Mutations in the C-terminal fragment of DnaK affecting peptide binding. Proc Natl Acad Sci U S A. 1996;93:10632–10637. - PMC - PubMed
    1. Dragovic Z, Broadley SA, Shomura Y, Bracher A, Hartl FU. Molecular chaperones of the Hsp110 family act as nucleotide exchange factors of Hsp70s. EMBO J. 2006;25:2519–2528. - PMC - PubMed
    1. Easton DP, Kaneko Y, Subjeck JR. The Hsp110 and Grp1 70 stress proteins: newly recognized relatives of the Hsp70s. Cell Stress Chaperones. 2000;5:276–290. - PMC - PubMed

Publication types

MeSH terms

Substances

Associated data