Functional interactions between BLM and XRCC3 in the cell
- PMID: 17923529
- PMCID: PMC2064734
- DOI: 10.1083/jcb.200702183
Functional interactions between BLM and XRCC3 in the cell
Abstract
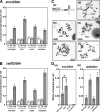
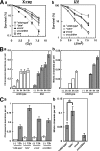
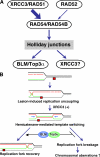
Bloom's syndrome (BS), which is caused by mutations in the BLM gene, is characterized by a predisposition to a wide variety of cancers. BS cells exhibit elevated frequencies of sister chromatid exchanges (SCEs), interchanges between homologous chromosomes (mitotic chiasmata), and sensitivity to several DNA-damaging agents. To address the mechanism that confers these phenotypes in BS cells, we characterize a series of double and triple mutants with mutations in BLM and in other genes involved in repair pathways. We found that XRCC3 activity generates substrates that cause the elevated SCE in blm cells and that BLM with DNA topoisomerase IIIalpha suppresses the formation of SCE. In addition, XRCC3 activity also generates the ultraviolet (UV)- and methyl methanesulfonate (MMS)-induced mitotic chiasmata. Moreover, disruption of XRCC3 suppresses MMS and UV sensitivity and the MMS- and UV-induced chromosomal aberrations of blm cells, indicating that BLM acts downstream of XRCC3.
Figures


Similar articles
-
Werner and Bloom helicases are involved in DNA repair in a complementary fashion.Oncogene. 2002 Jan 31;21(6):954-63. doi: 10.1038/sj.onc.1205143. Oncogene. 2002. PMID: 11840341
-
Analyses of functional interaction between RECQL1, RECQL5, and BLM which physically interact with DNA topoisomerase IIIalpha.Biochim Biophys Acta. 2008 Feb;1782(2):75-81. doi: 10.1016/j.bbadis.2007.11.003. Epub 2007 Nov 22. Biochim Biophys Acta. 2008. PMID: 18078829
-
Evidence for BLM and Topoisomerase IIIalpha interaction in genomic stability.Hum Mol Genet. 2001 Jun 1;10(12):1287-98. doi: 10.1093/hmg/10.12.1287. Hum Mol Genet. 2001. PMID: 11406610
-
Role of the BLM helicase in replication fork management.DNA Repair (Amst). 2007 Jul 1;6(7):936-44. doi: 10.1016/j.dnarep.2007.02.007. Epub 2007 Mar 23. DNA Repair (Amst). 2007. PMID: 17363339 Review.
-
[Function of RecQ family helicases and Bloom's syndrome].Tanpakushitsu Kakusan Koso. 2001 Jun;46(8 Suppl):1082-8. Tanpakushitsu Kakusan Koso. 2001. PMID: 11436296 Review. Japanese. No abstract available.
Cited by
-
ATM- and ATR-mediated phosphorylation of XRCC3 regulates DNA double-strand break-induced checkpoint activation and repair.Mol Cell Biol. 2013 May;33(9):1830-44. doi: 10.1128/MCB.01521-12. Epub 2013 Feb 25. Mol Cell Biol. 2013. PMID: 23438602 Free PMC article.
-
RMI, a new OB-fold complex essential for Bloom syndrome protein to maintain genome stability.Genes Dev. 2008 Oct 15;22(20):2843-55. doi: 10.1101/gad.1708608. Genes Dev. 2008. PMID: 18923082 Free PMC article.
-
BLM Deficiency Is Not Associated with Sensitivity to Hydroxyurea-Induced Replication Stress.J Nucleic Acids. 2010 Sep 8;2010:319754. doi: 10.4061/2010/319754. J Nucleic Acids. 2010. PMID: 20936166 Free PMC article.
-
Distinct pathways of homologous recombination controlled by the SWS1-SWSAP1-SPIDR complex.Nat Commun. 2021 Jul 12;12(1):4255. doi: 10.1038/s41467-021-24205-6. Nat Commun. 2021. PMID: 34253720 Free PMC article.
-
Comprehensive assessment of the association between DNA repair gene XRCC3 rs861539 C/T polymorphism and lung cancer risk.Tumour Biol. 2013 Oct;34(5):2521-7. doi: 10.1007/s13277-013-0705-3. Epub 2013 Aug 28. Tumour Biol. 2013. PMID: 23982880
References
-
- Bezzubova, O., A. Silbergleit, Y. Yamaguchi-Iwai, S. Takeda, and J.M. Buerstedde. 1997. Reduced X-ray resistance and homologous recombination frequencies in a RAD54 −/− mutant of the chicken DT40 cell line. Cell. 89:185–193. - PubMed
-
- Branzei, D., J. Sollier, G. Liberi, X. Zhao, D. Maeda, M. Seki, T. Enomoto, K. Ohta, and M. Foiani. 2006. Ubc9- and mms21-mediated sumoylation counteracts recombinogenic events at damaged replication forks. Cell. 127:509–522. - PubMed
-
- Braybrooke, J.P., J.L. Li, L. Wu, F. Caple, F.E. Benson, and I.D. Hickson. 2003. Functional interaction between the Bloom's syndrome helicase and the RAD51 paralog, RAD51L3 (RAD51D). J. Biol. Chem. 278:48357–48366. - PubMed

