. 2007 Nov;81(5):974-86.
doi: 10.1086/521690. Epub 2007 Sep 17.

The first genomewide interaction and locus-heterogeneity linkage scan in bipolar affective disorder: strong evidence of epistatic effects between loci on chromosomes 2q and 6q

Affiliations

The first genomewide interaction and locus-heterogeneity linkage scan in bipolar affective disorder: strong evidence of epistatic effects between loci on chromosomes 2q and 6q

Rami Abou Jamra et al. Am J Hum Genet. 2007 Nov.

Abstract

We present the first genomewide interaction and locus-heterogeneity linkage scan in bipolar affective disorder (BPAD), using a large linkage data set (52 families of European descent; 448 participants and 259 affected individuals). Our results provide the strongest interaction evidence between BPAD genes on chromosomes 2q22-q24 and 6q23-q24, which was observed symmetrically in both directions (nonparametric LOD [NPL] scores of 7.55 on 2q and 7.63 on 6q; P<.0001 and P=.0001, respectively, after a genomewide permutation procedure). The second-best BPAD interaction evidence was observed between chromosomes 2q22-q24 and 15q26. Here, we also observed a symmetrical interaction (NPL scores of 6.26 on 2q and 4.59 on 15q; P=.0057 and .0022, respectively). We covered the implicated regions by genotyping additional marker sets and performed a detailed interaction linkage analysis, which narrowed the susceptibility intervals. Although the heterogeneity analysis produced less impressive results (highest NPL score of 3.32) and a less consistent picture, we achieved evidence of locus heterogeneity at chromosomes 2q, 6p, 11p, 13q, and 22q, which was supported by adjacent markers within each region and by previously reported BPAD linkage findings. Our results provide systematic insights in the framework of BPAD epistasis and locus heterogeneity, which should facilitate gene identification by the use of more-comprehensive cloning strategies.


Figures
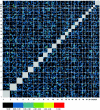
Figure  1.
Figure 1.
Genomewide interaction scan for BPAD. The different levels of ΔNPL scores are presented using different colors: red indicates ΔNPL scores >4; yellow indicates ΔNPL scores >3; green indicates ΔNPL scores >2; light blue indicates ΔNPL scores >1; dark blue indicates ΔNPL scores >0; black indicates ΔNPL scores <0.
Figure  2.
Figure 2.
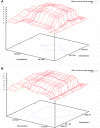
Three-dimensional ΔNPL plot for the BPAD interaction between chromosomes 2q22-q24 and 6q23-q24. The 1-LOD intervals are given at the bottom of the plot, in blue. Genetic-marker positions are determined from the deCODE Genetics sex-averaged map, and ΔNPL scores are indicated by red lines. A, Interaction on chromosome 2q22-q24, presented using STRs on 6q as conditional markers (highest ΔNPL score 6.69). B, Interaction on chromosome 6q23-q24, presented using STRs on 2q as conditional markers (highest ΔNPL score 4.84).
Figure  3.
Figure 3.
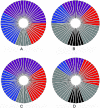
Proportions of families contributing to the BPAD interaction. Each unit represents one linkage family (total n=52). A, BPAD interaction between chromosomes 2q22-q24 (D2S1353, D2S381, D2S222, D2S321, and D2S2950) and 6q23-q24 (D6S1587, D6S1626, D6S1699, D6S403, and D6S1569). Red indicates 10 families assigned a weightPROP factor >0 at markers within the top 10 interaction interval on 2q22-q24 and assigned a weightPROP factor of 0 at markers within the top 10 interaction interval on 6q23-q24. Blue indicates 14 families assigned a weightPROP factor >0 at markers on 6q23-q24 and assigned a weightPROP factor of 0 at markers on 2q22-q24. Purple indicates 22 families assigned a weightPROP factor >0 at markers on 2q22-q24 and at markers on 6q23-q24. Gray indicates six families assigned a weightPROP factor of 0 at all markers on 2q22-q24 and on 6q23-q24. B, Proportions of families with strong contribution—defined by weightPROP factors >1—to the BPAD interaction between chromosomes 2q22-q24 and 6q23-q24. Red indicates eight families assigned a weightPROP factor >1 at markers on 2q22-q24 and assigned a weightPROP factor of 0 at markers on 6q23-q24. Blue indicates eight families assigned a weightPROP factor >1 at markers on 6q23-q24 and assigned a weightPROP factor of 0 at markers on 2q22-q24. Purple indicates 11 families assigned a weightPROP factor >1 at markers on 2q22-q24 and at markers on 6q23-q24. Gray indicates 19 families assigned a weightPROP factor >0 at markers on 2q22-q24 (right) or at markers on 6q23-q24 (left). Black indicates six families assigned a weightPROP factor of 0 at all markers on 2q22-q24 and on 6q23-q24. C, BPAD interaction between chromosomes 2q22-q24 (D2S1353, D2S2395, D2S2950, D2S381, or D2S222) and 15q26 (STR15-980, STR15-994, or D15S107). Red indicates 15 families assigned a weightPROP factor >0 at markers on 2q22-q24 and assigned a weightPROP factor of 0 at markers on 15q26. Blue indicates 14 families assigned a weightPROP factor >0 at markers on 15q26 and assigned a weightPROP factor of 0 at markers on 2q22-q24. Purple indicates 17 families assigned a weightPROP factor >0 at markers on 2q22-q24 and at markers on 15q26. Gray indicates six families assigned a weightPROP factor of 0 at all markers within the top 10 interaction interval on 2q22-q24 and on 15q26. D, Proportions of families with strong contribution—defined by weightPROP factors >1—to the BPAD interaction between chromosomes 2q22-q24 and 15q26. Red indicates 12 families assigned a weightPROP factor >1 at markers on 2q22-q24 and assigned a weightPROP factor of 0 at markers on 15q26. Blue indicates four families assigned a weightPROP factor >1 at markers on 15q26 and assigned a weightPROP factor of 0 at markers on 2q22-q24. Purple indicates 11 families assigned a weightPROP factor >1 at markers on 2q22-q24 and at markers on 15q26. Gray indicates 22 families assigned a weightPROP factor of >0 at markers on 2q22-q24 (right) or at markers on 15q26 (left). Black indicates six families assigned a weightPROP factor of 0 at all markers within the top 10 interaction interval on 2q22-q24 and on 15q26.
Figure  4.
Figure 4.
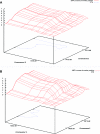
Three-dimensional ΔNPL plot for the BPAD interaction between chromosome 2q22-q24 and 15q26. The 1-LOD intervals are given at the bottom of the plot, in blue. Genetic-marker positions are determined from the deCODE Genetics sex-averaged map, and ΔNPL scores are indicated by red lines. A, Interaction on chromosome 15q26, presented using STRs on 2q as conditional markers (highest ΔNPL score 3.74). B, Interaction on chromosome 2q22-q24, presented using STRs on 15q as conditional markers (highest ΔNPL score 5.62).

Similar articles

Cited by

References

Web Resources

    1. deCODE Genetics, http://www.decode.com (for information about the genetic map)
    1. Institute for Medical Biometry, Informatics and Epidemiology, University of Bonn, http://mendel.meb.uni-bonn.de/~rfuerst/supplementary/ (for statistical programs used in the present study)
    1. NCBI, http://www.ncbi.nlm.nih.gov/ (for information about BPAD and the candidate genes)
    1. Online Mendelian Inheritance in Man (OMIM), http://www.ncbi.nlm.nih.gov/Omim/ (for BPAD, TNFAIP6, NMI, TNFAIP3, IL20RA, IL22RA2, IFNGR1, BDNF, and DTNBP1)
    1. UCSC Genome Browser, http://genome.ucsc.edu/ (for information about the marker positions and RefSeq Genes track)

References

    1. Craddock N, Jones I (1999) Genetics of bipolar disorder. J Med Genet 36:585–594 - PMC - PubMed
    1. Craddock N, Forty L (2006) Genetics of affective (mood) disorders. Eur J Hum Genet 14:660–66810.1038/sj.ejhg.5201549 - DOI - PubMed
    1. Segurado R, Detera-Wadleigh SD, Levinson DF, Lewis CM, Gill M, Nurnberger JI, Craddock N, DePaulo JR, Baron M, Gershon ES, et al (2003) Genome scan meta-analysis of schizophrenia and bipolar disorder, part III: bipolar disorder. Am J Hum Genet 73:49–62 - PMC - PubMed
    1. Schumacher J, Kaneva R, Jamra RA, Diaz GO, Ohlraun S, Milanova V, Lee YA, Rivas F, Mayoral F, Fuerst R, et al (2005) Genomewide scan and fine-mapping linkage studies in four European samples with bipolar affective disorder suggest a new susceptibility locus on chromosome 1p35-p36 and provides further evidence of loci on chromosome 4q31 and 6q24. Am J Hum Genet 77:1102–1111 - PMC - PubMed
    1. American Psychiatric Association (1994) DSM-IV: diagnostic and statistical manual of mental disorders, 4th ed. American Psychiatric Association, Washington, DC

Publication types

Substances