. 2007;17(12):1252-71.
doi: 10.1002/hipo.20374.

Grid cell firing may arise from interference of theta frequency membrane potential oscillations in single neurons

Affiliations

Grid cell firing may arise from interference of theta frequency membrane potential oscillations in single neurons

Michael E Hasselmo et al. Hippocampus. 2007.

Abstract

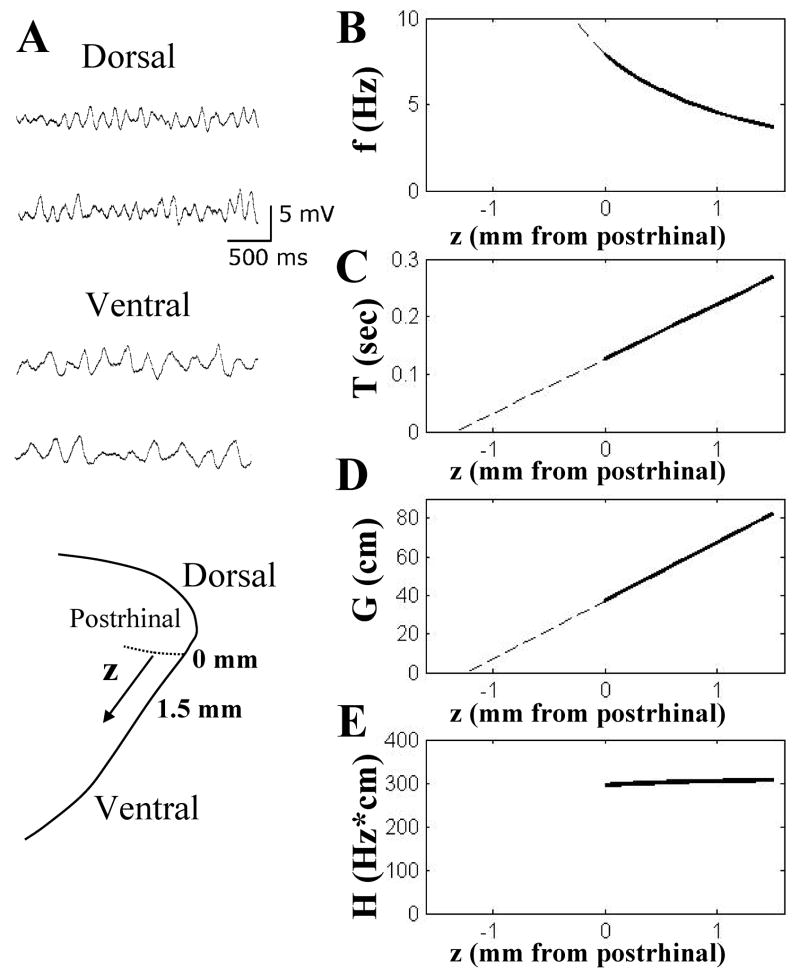
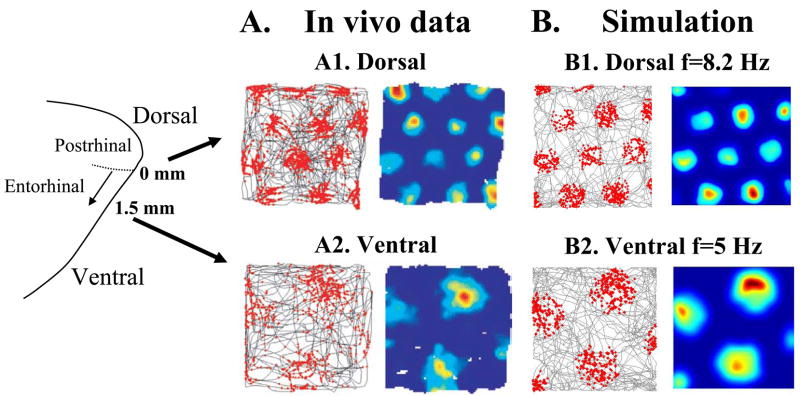
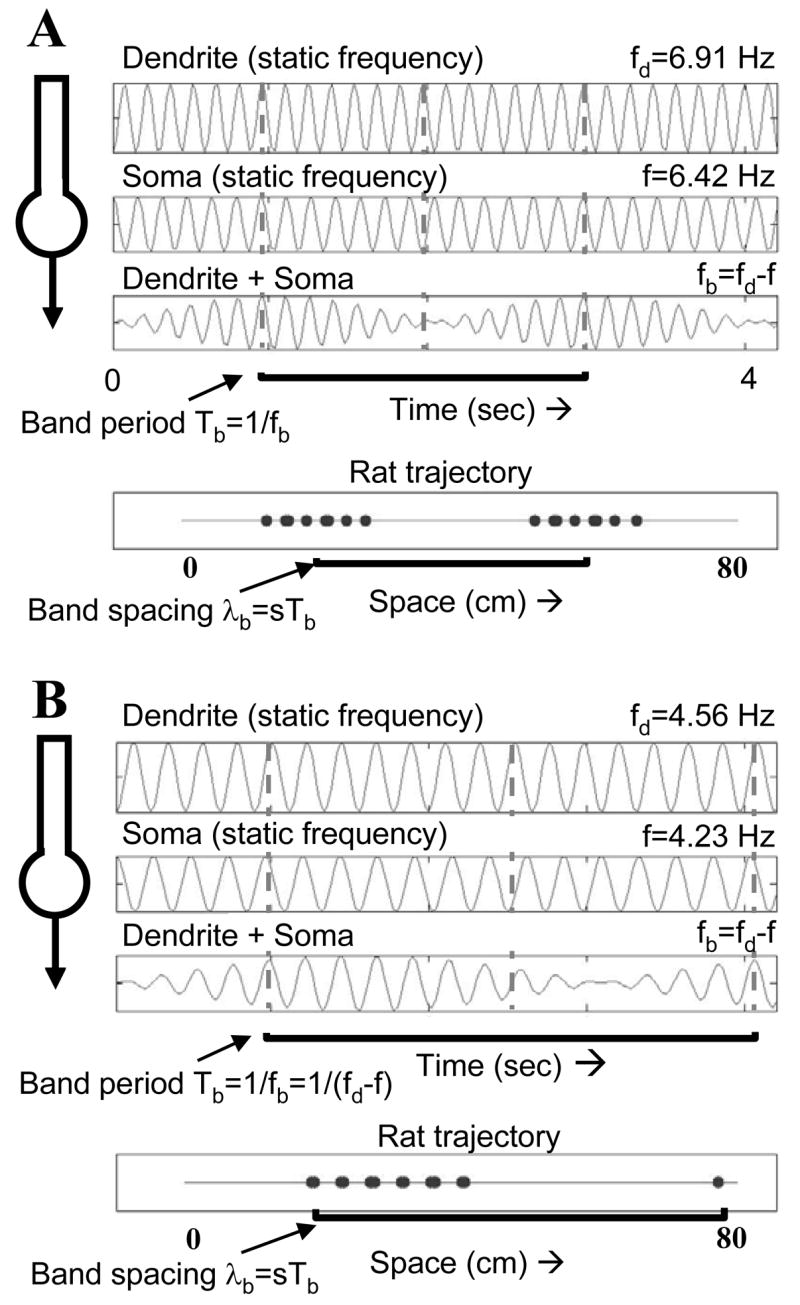
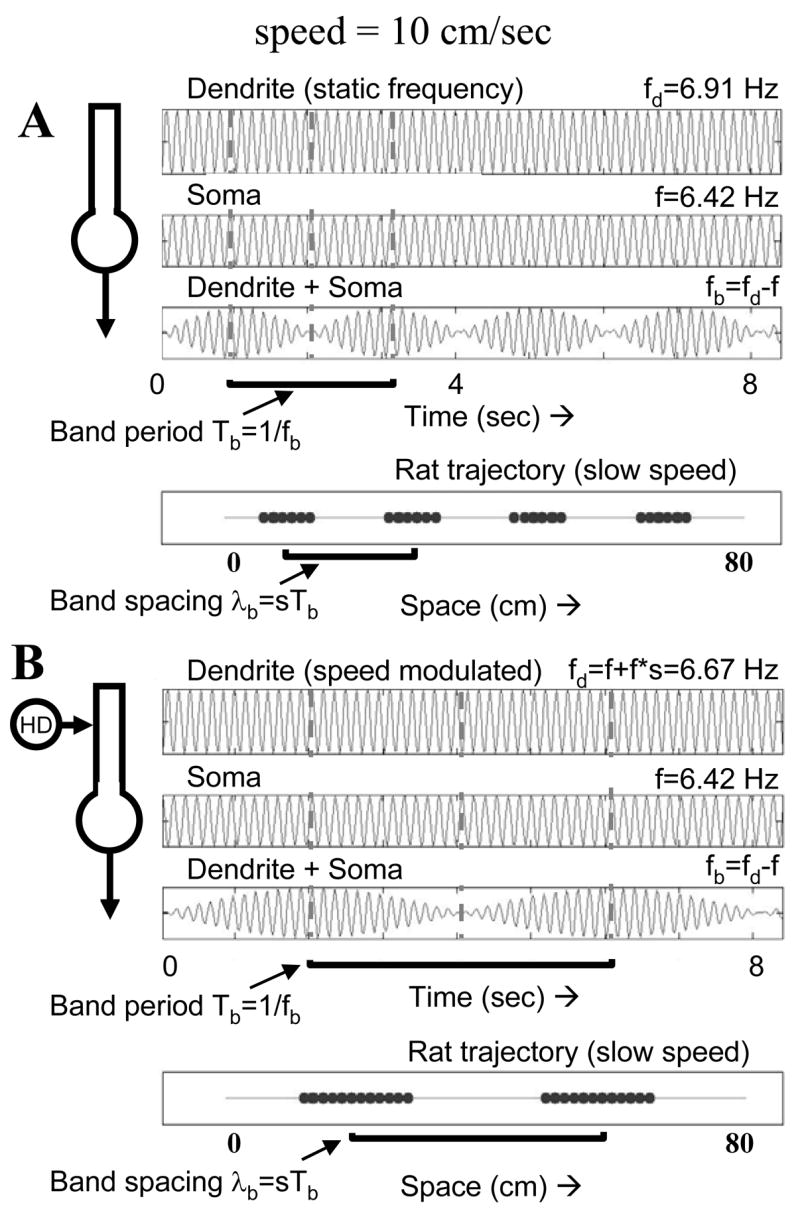
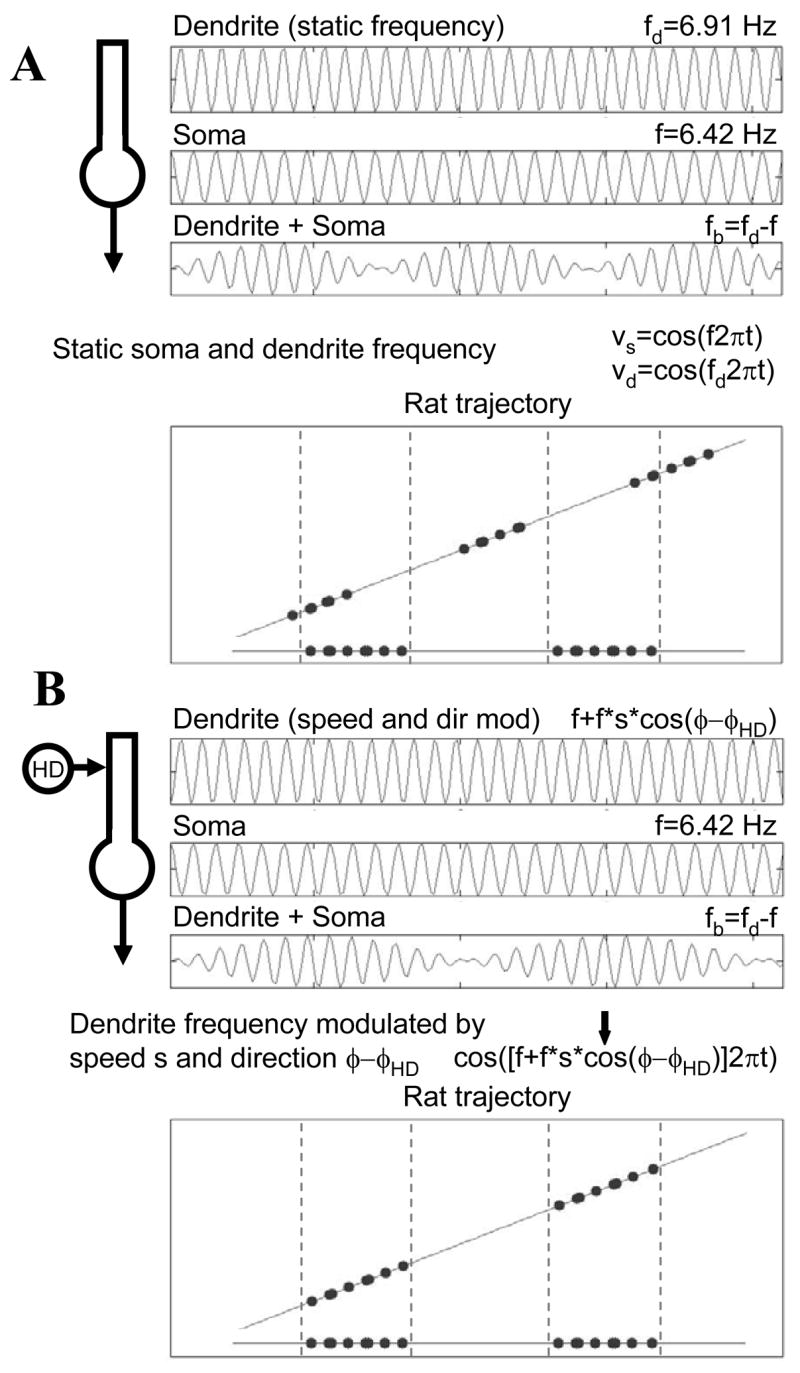
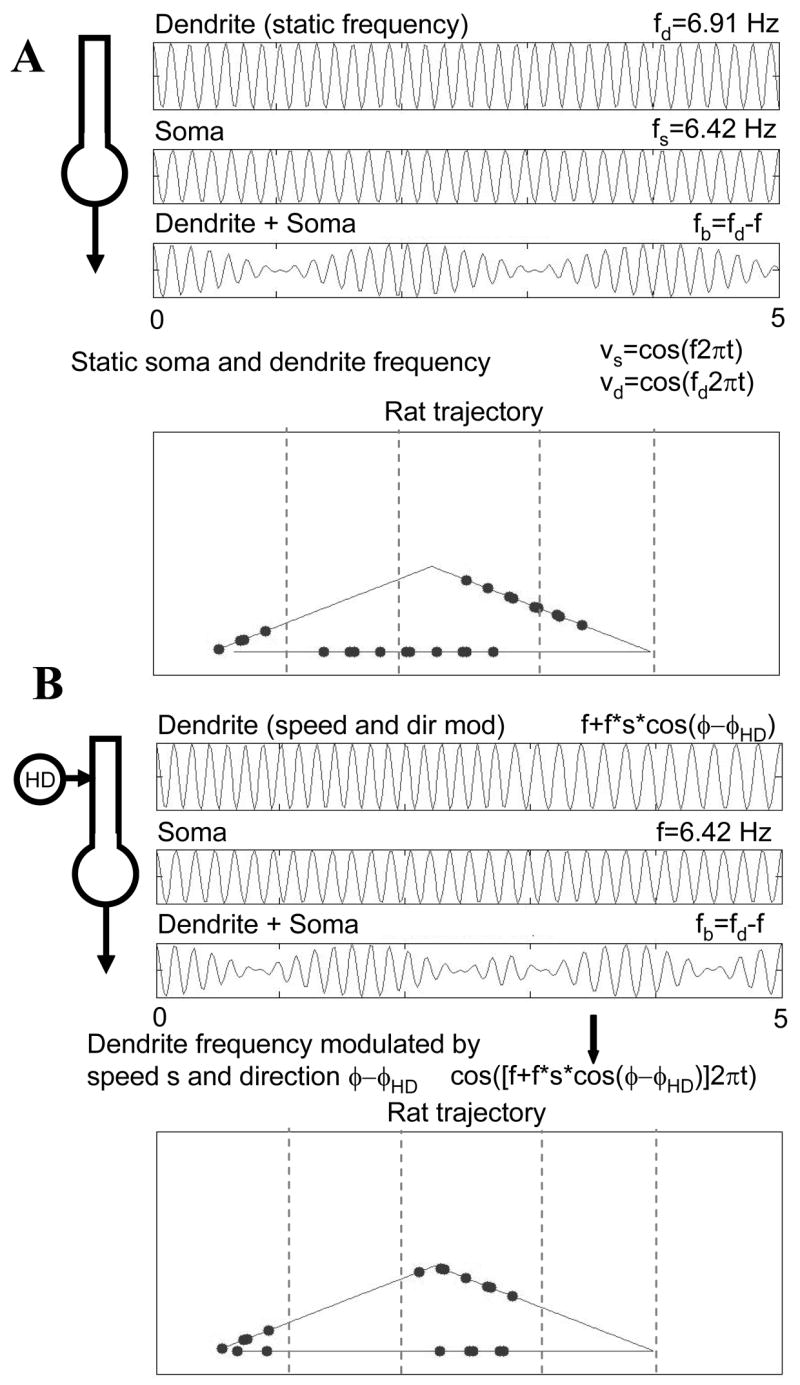
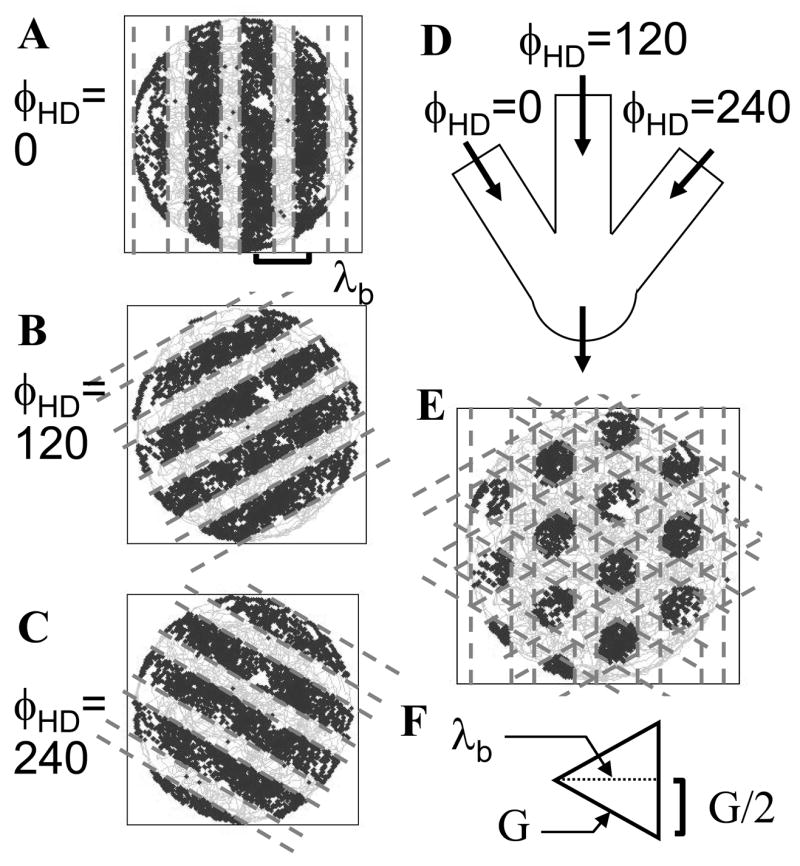
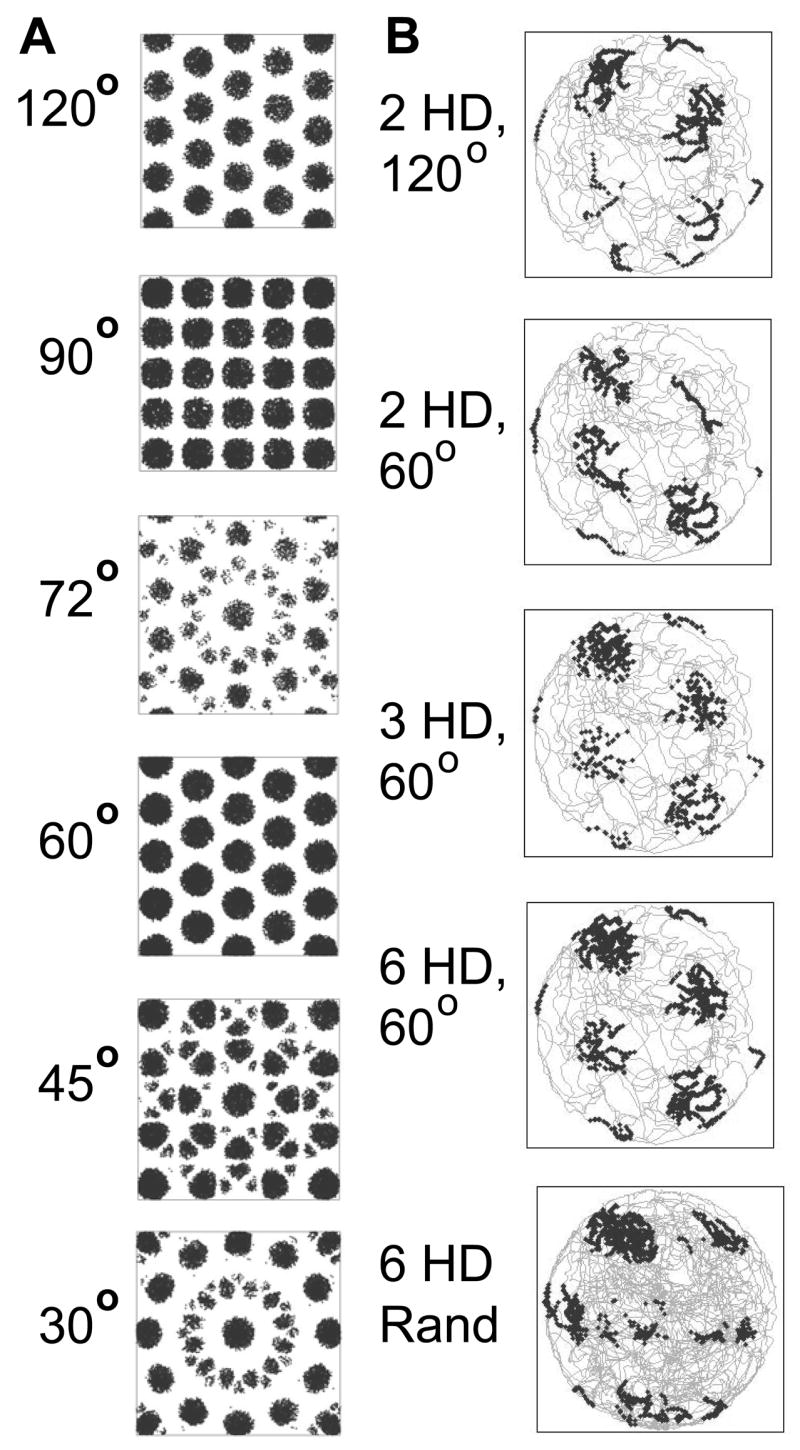
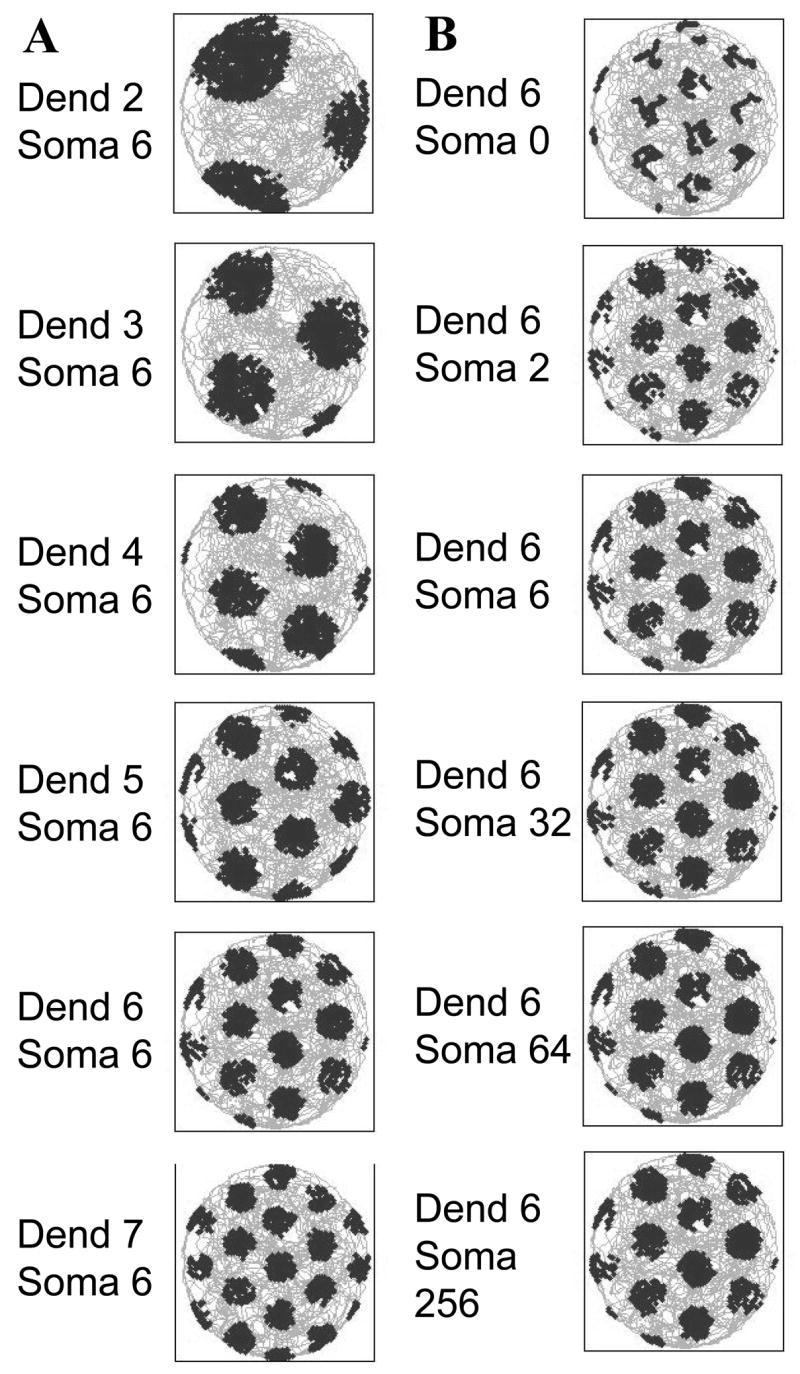
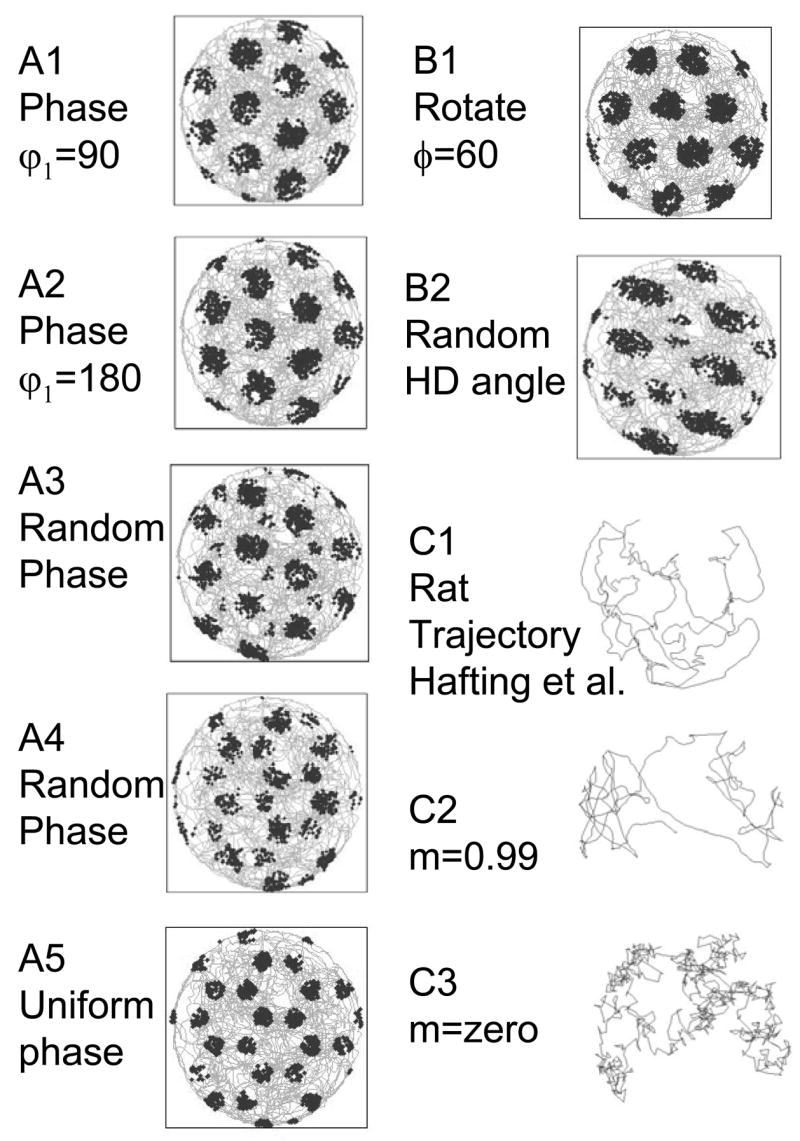
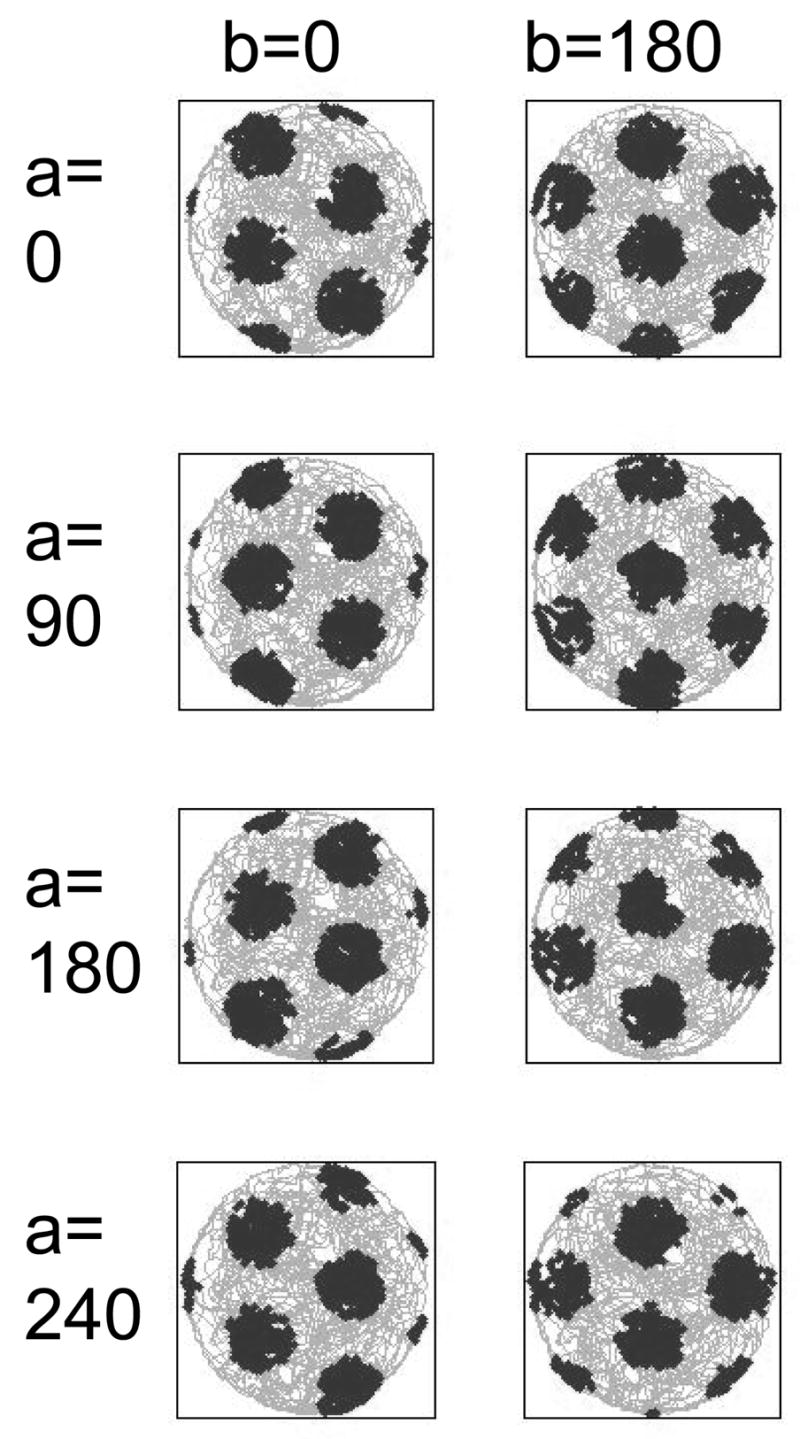
Intracellular recording and computational modelling suggest that interactions of subthreshold membrane potential oscillation frequency in different dendritic branches of entorhinal cortex stellate cells could underlie the functional coding of continuous dimensions of space and time. Among other things, these interactions could underlie properties of grid cell field spacing. The relationship between experimental data on membrane potential oscillation frequency (f) and grid cell field spacing (G) indicates a constant scaling factor H = fG. This constant scaling factor between temporal oscillation frequency and spatial periodicity provides a starting constraint that is used to derive the model of Burgess et al. (Hippocampus, 2007). This model provides a consistent quantitative link between single cell physiological properties and properties of spiking units in awake behaving animals. Further properties and predictions of this model about single cell and network physiological properties are analyzed. In particular, the model makes quantitative predictions about the change in membrane potential, single cell oscillation frequency, and network oscillation frequency associated with speed of movement, about the independence of single cell properties from network theta rhythm oscillations, and about the effect of variations in initial oscillatory phase on the pattern of grid cell firing fields. These same mechanisms of subthreshold oscillations may play a more general role in memory function, by providing a method for learning arbitrary time intervals in memory sequences.


Figures

Figure 1
Figure 1
A. Neurons show higher frequency of subthreshold oscillations in slices of dorsal entorhinal cortex (top traces) and lower frequency in ventral slices (bottom traces). Schematic diagram at bottom shows distance from the dorsal border with postrhinal cortex. B. Plot of change in subthreshold oscillation frequency f (in Hz) with distance from postrhinal border (z, in mm) based on reciprocal of data shown in 1C. C. Plot of period (T, in sec) of subthreshold oscillations relative to distance from postrhinal border (z, in mm) directly based on the equation from linear fit of data (Giocomo et al., 2007). Dashed line shows extrapolation beyond border. D. Plot of grid cell field spacing (G, in cm) relative to distance from postrhinal border (z, in mm) based on equation from linear fit of previously published data (Sargolini et al., 2006). E. Plot of scaling value H (in Hz-cm) based on product of f and G. Note that this value stays near 300 Hz-cm.
Figure 2
Figure 2
Simulation of the Burgess model with different oscillation frequencies replicates differences in dorsal to ventral grid cell spacing. A1. Previously published recording data (Hafting et al., 2005) from a single dorsal grid cell showing closely spaced grid fields. Plot on left shows the location of the rat at the time of each spike in red and the overall rat movement trajectory in gray. Right plot shows Gaussian smoothing of mean firing rate (red=high rate, blue=no firing). A2. Data from a single ventral cell showing larger spacing between grid fields in both spike location plots (left) and firing rate plots (right). B1. Simulation of grid fields using membrane potential oscillation frequency of 8.2 Hz, with rat starting position at x=−4, y=−8 cm, and head direction cells at 60 degree intervals starting at 36 degrees. Left plot shows location of simulated rat during each spike in red with trajectory in gray produced by random movement algorithm. Mean firing rate is shown in right plot. B2. Simulation of ventral grid fields with oscillation frequency of 5 Hz, starting position x=15, y=30 cm, and head direction cells at 60 degree intervals starting at -12 degrees. Plots show wider grid field spacing with the lower frequency.
Figure 3
Figure 3
Plot of single simulated grid cell with subthreshold oscillation frequency of 6.42 Hz, summed over different time periods from the start of exploration (first 40 seconds, 3 min, 6 min, 12 min). Note that the firing of the neuron occurs in specific regularly spaced grid fields, even though the simulated rat follows an irregular trajectory with varying direction and speed based on experimental data (Hafting et al., 2005).
Figure 4
Figure 4
Simulations of interference between oscillations in dendrite and soma. A. Static frequencies of 6.91 Hz in the dendrite and 6.42 Hz in the soma (mean dorsal frequency in data) result in an oscillatory interference pattern with frequency fb 0.49 Hz and period Tb of 2.04 sec. At a speed of 20 cm/sec this results in a distance between firing (spatial wavelength λb) of about 40 cm. B. Shifting the frequencies to lower levels representing ventral frequencies 4.56 Hz in dendrite and 4.23 Hz in soma results in interference with frequency of 0.33 Hz and period of 3.03 sec. At a constant speed of 20 cm/sec this results in a spatial wavelength of about 60 cm.
Figure 5
Figure 5
Differences in speed require scaling of dendrite frequency by speed. A. The same frequencies used in Figure 4A are used with a rat speed of 10 cm/sec. The time scale is doubled to show the same range of spatial movement of the rat. The period of interference is still 2.04 sec, but at a speed of 10 cm/sec the spacing between firing is about 20 cm. B. Modulation of dendrite frequency proportional to speed ensures that grid cell field spacing stays the same. For a speed of 10 cm/sec, the speed-scaled modulation results in the dendrite frequency being 6.67 Hz. This reduces the interference frequency to 0.25 Hz and increases the period to 4 sec. This results in a spatial wavelength of 40 cm. The same spatial wavelength was obtained in Figure 4A at a speed 20 cm/sec, where dendrite frequency was modulated to 6.91 Hz, causing a period of 2 seconds and wavelength of 40 cm.
Figure 6
Figure 6
Changes in direction of movement also need compensation. A. Comparison of two directions of movement showing that with static frequency the spiking occurs at the same temporal interval but does not match the spatial wavelength. B. Modulation of dendritic frequency proportional to the cosine of head direction allows the spiking activity to line up with a consistent spatial wavelength λb in one dimension (as indicated by vertical lines). This modulation based on head direction can be provided by a head direction cell represented by the circle with HD.
Figure 7
Figure 7
Spiking activity during movement along a triangular pathway through the environment. A. Static oscillation frequencies in dendrite and soma result in spiking at regular temporal intervals, but do not show consistency with spatial dimensions. B. In contrast, modulation of dendritic frequency by speed and head direction ensures that firing occurs consistently within vertical spatial bands (defined relative to horizontal position). The vertical dotted lines indicate the consistent intervals of spatial firing.
Figure 8
Figure 8
Combination of bands of interference from different dendrites results in the grid cell firing pattern. Each head direction cell causes interference with consistent spatial wavelength in bands running perpendicular to the selective direction preference of the individual head direction cell. A–C. Interference bands due to modulation of dendritic frequency by head direction cells with specific direction preferences angles at zero (A), 120 degrees (B) and 240 degrees (C). D. Schematic of the interaction of different dendrites with interference bands modulated by input from different head direction cells. E. The product of interference bands due to different dendritic oscillations cause the soma to cross firing threshold in a pattern matching grid cell firing fields. F. Equilateral triangle illustrating the relationship between the spatial wavelength λb of band interference (height of triangle) and the grid cell spacing G (length of one side).
Figure 9
Figure 9
A. Effect of different head direction inputs with different intervals between direction preference angles on simulated grid cell firing fields for a neuron with intrinsic frequency of 7 Hz. A1. Input from three head direction cells (3 HD) at 120 degree intervals of selectivity (top) gives grid patterns of tessellated equilateral triangles (hexagons). A2. Four head direction cells with 90 degree selectivity intervals create a square grid. A3. 5 HD cells at 72 degree intervals create a complex pattern with radial symmetry but no translational equivalence. A4. Six HD cells at 60 degree intervals create a grid pattern similar to that for 120 degree intervals. A5 and A6. 8 HD cells at 45 degrees and 12 HD cells at 30 degree intervals create complex patterns with radial symmetry but no translational equivalence. B. Simulated grid cells with different numbers of head direction inputs show a less consistent grid pattern with two HD cells, but similar properties with 3 HD and 6 HD cell inputs. The simulated grid cell has an intrinsic frequency of 4 Hz in B.
Figure 10
Figure 10
A. The simulated grid cell field spacing depends on the baseline frequency in dendrites (Dend), even when the frequency at the soma remains static at 6 Hz (Soma). Examples are shown for dendritic baseline frequencies of Dend=2, 3, 4, 5, 6 and 7 Hz. B. In contrast, the simulated grid cell field spacing does not depend on different soma frequencies, even when these are varied in a range between Soma=0 and Soma=256 Hz. The grid field spacing depends only on the dendritic frequency (Dend=6) which is modulated by speed and head direction.
Figure 11
Figure 11
A. Examples of different grid cell firing patterns with manipulations of the phase of oscillations in different dendrites. A1. The grid field shows a 90 degree rightward translation with the following phase shift (in radians) for the dendrites ϕd = (π/2 −π/2 0). A2. Change in grid fields with phase shift of ϕd = (ππ 0) in radians. A3. Effect of random phase shifts ϕd = (2.8 0.1 5.2) in radians. A4. Effect of random phase shifts ϕd = (5.3 3.3 1.3) in radians that resembles the effect of a uniform phase shift. A5. Effect of uniform phase shift of ϕd = (π π π). B1. Rotation of grid fields with addition of 60 degrees (π/6 radians) to each HD cell angle. B2. Effect of input from HD cells with random selectivity angles of φHD = (4.4 3.9 5.0). C1. Plot of the trajectory of a real rat from the experimental data by Hafting et al. (2005). C2. Trajectory of the virtual rat with momentum set at m=0.99. C3. Trajectory of the virtual rat with no momentum (m=0), showing the abrupt direction shifts that do not resemble the real rat trajectory.
Figure 12
Figure 12
Effect of systematic initial phase shifts on grid cell firing patterns using different values of a and b in the formula for translation of grid fields in horizontal (b) and vertical (a) directions. The two columns show the effect of simultaneously setting b at 0 or 180 degrees (0 or π radians). The four rows show the effect of phase shifts using a=0, 90, 180 and 240 degrees (0, π/2, π, 3π/2 radians).

Similar articles

Cited by

References

    1. Alonso A, Garcia-Austt E. Neuronal sources of theta rhythm in the entorhinal cortex of the rat. I. Laminar distribution of theta field potentials. Experimental Brain Research. 1987a;67(3):493–501. - PubMed
    1. Alonso A, Garcia-Austt E. Neuronal sources of theta rhythm in the entorhinal cortex of the rat. II. Phase relations between unit discharges and theta field potentials. Exp Brain Res. 1987b;67(3):502–9. - PubMed
    1. Alonso A, Klink R. Differential electroresponsiveness of stellate and pyramidal-like cells of medial entorhinal cortex layer II. J Neurophysiol. 1993;70(1):128–43. - PubMed
    1. Alonso A, Llinas RR. Subthreshold Na-dependent theta-like rhythmicity in stellate cells of entorhinal cortex layer II. Nature. 1989;342:175–177. - PubMed
    1. Beggs JM, Moyer JR, Jr, McGann JP, Brown TH. Prolonged synaptic integration in perirhinal cortical neurons. J Neurophysiol. 2000;83(6):3294–8. - PubMed

Publication types