

Vascular endothelial growth factor and nitric oxide production in response to hypoxia in the choroid plexus in neonatal brain
- PMID: 17924979
- PMCID: PMC8095499
- DOI: 10.1111/j.1750-3639.2007.00104.x
Vascular endothelial growth factor and nitric oxide production in response to hypoxia in the choroid plexus in neonatal brain
Abstract
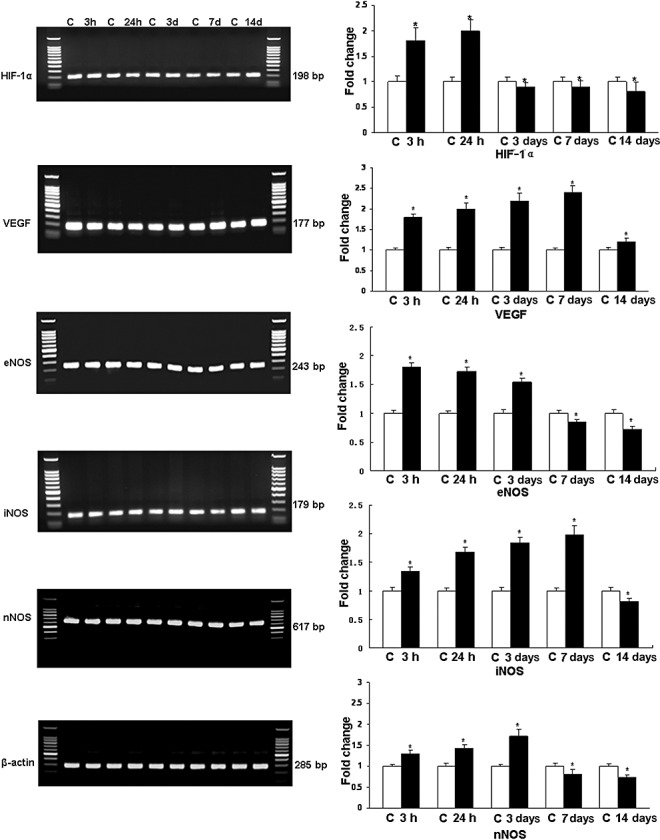
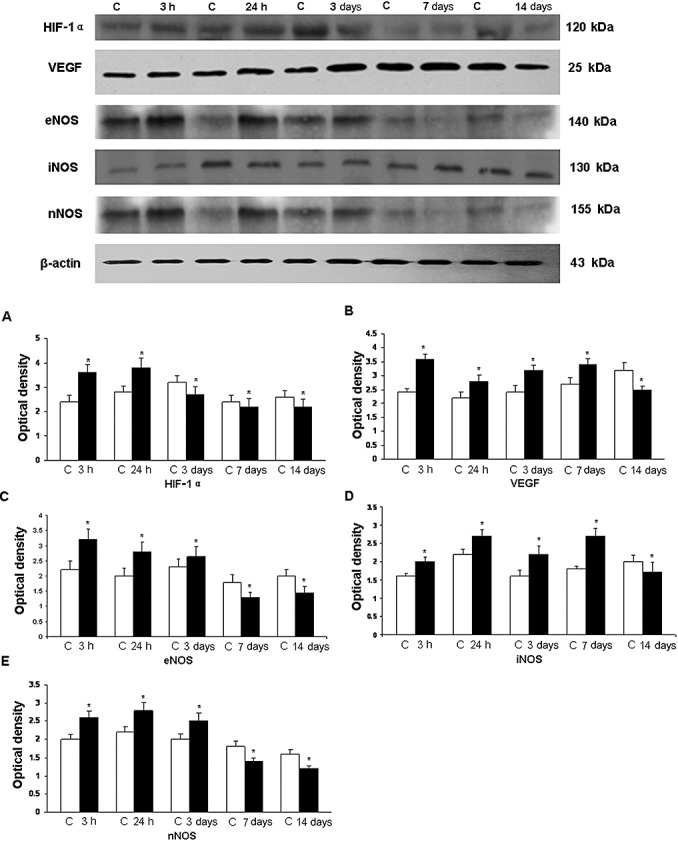
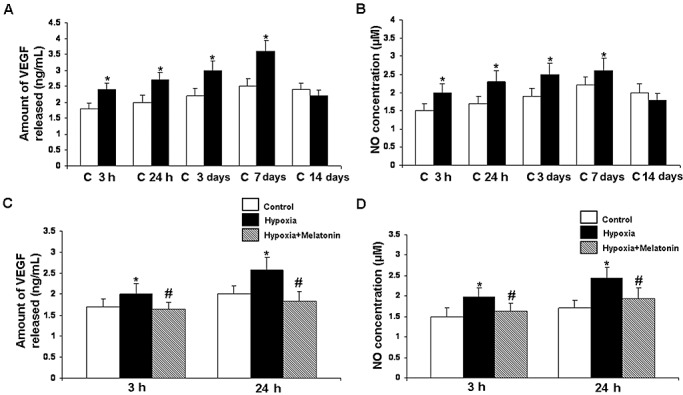
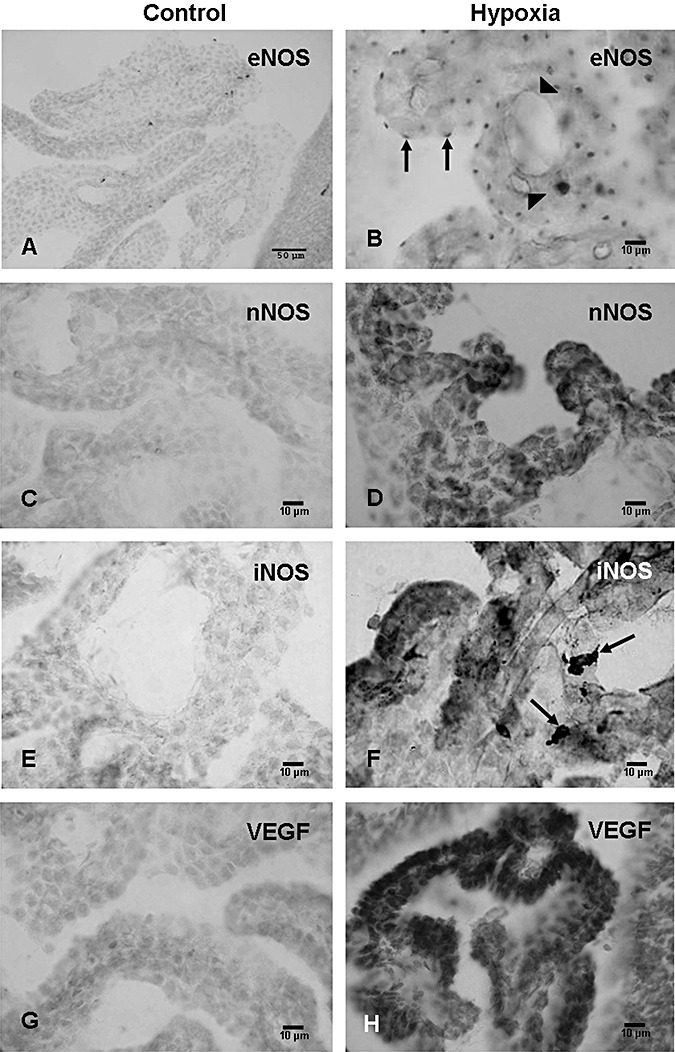
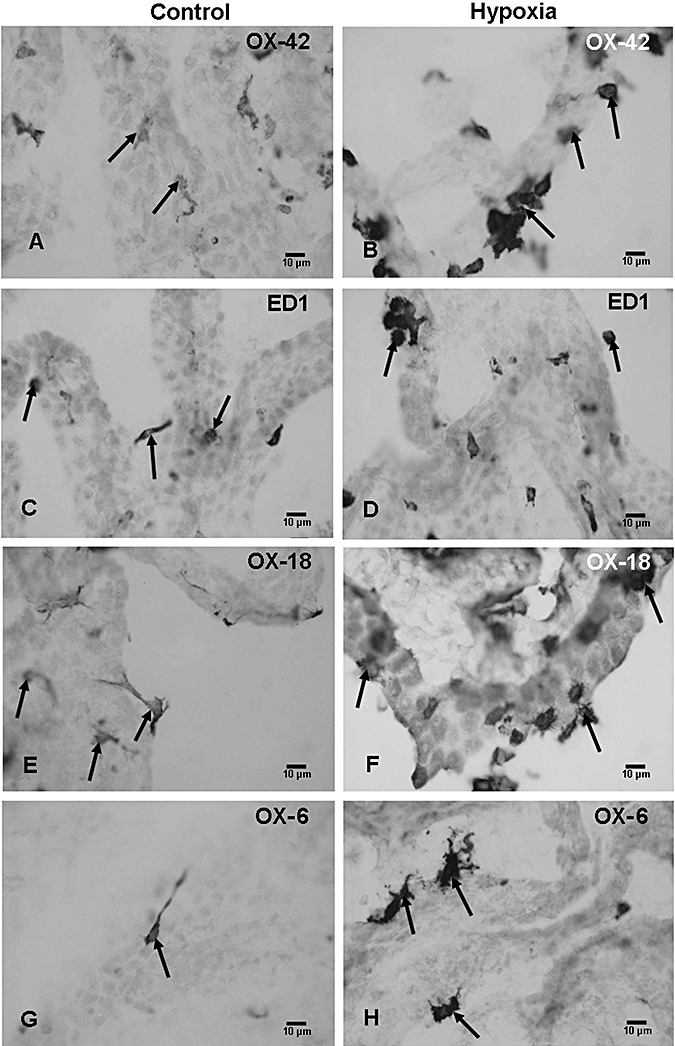
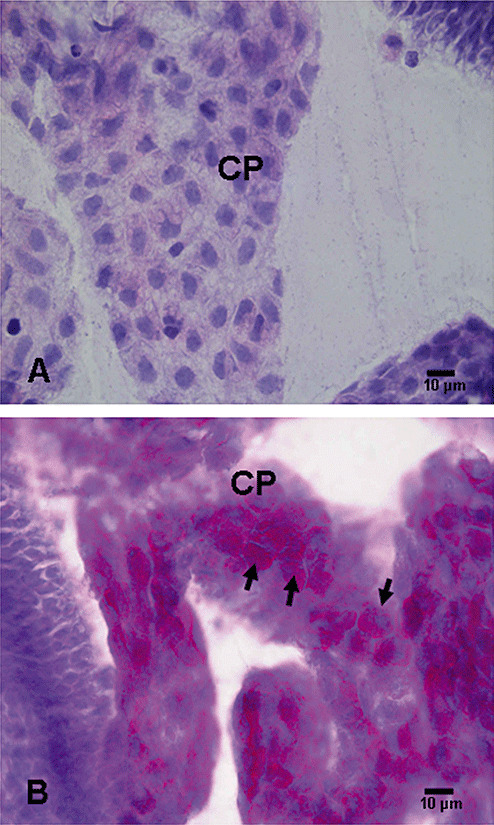
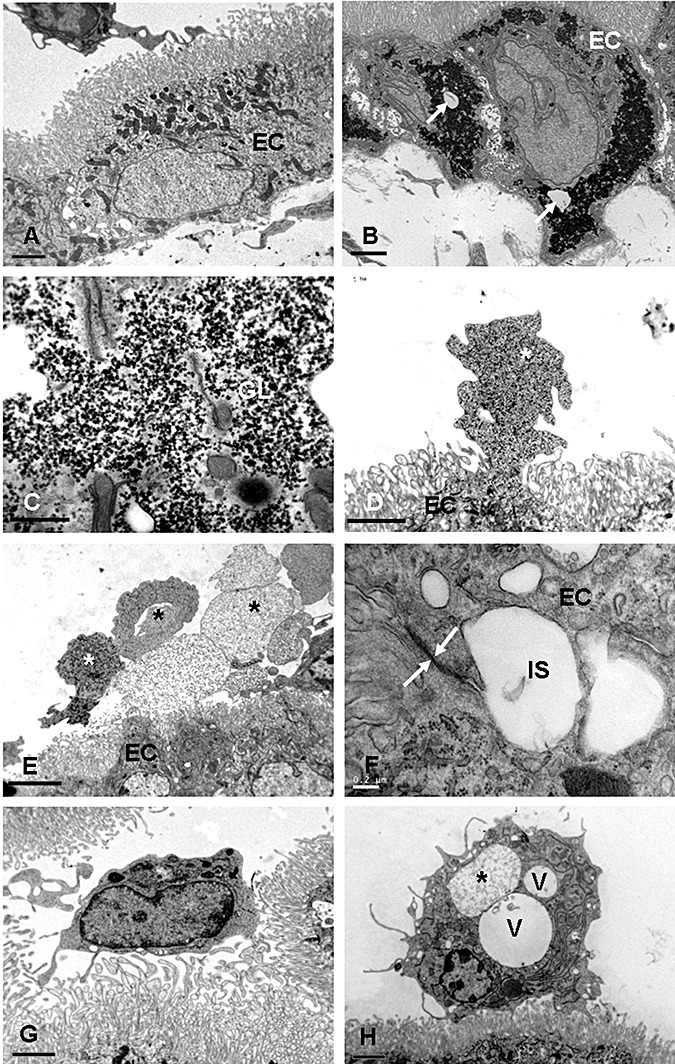
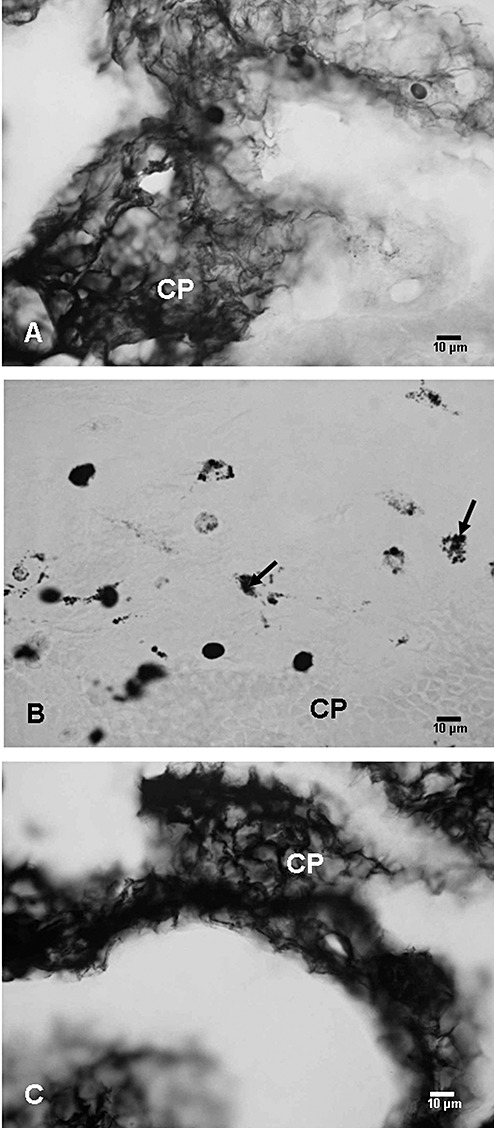
Damage to the choroid plexus in 1-day-old Wistar rats subjected to hypoxia was investigated. The mRNA and protein expression of hypoxia-inducible factor-1alpha (HIF-1alpha), endothelial, neuronal, inducible nitric oxide synthase (eNOS, nNOS, iNOS), and vascular endothelial growth factor (VEGF) along with nitric oxide (NO) production and VEGF concentration was up-regulated significantly in hypoxic rats. Ultrastructurally, the choroid plexus epithelial cells showed massive accumulation of glycogen. A striking feature was the extrusion of cytoplasmic fragments from the apical cell surfaces into the ventricular lumen following the hypoxic insult. Intraventricular macrophages showed increased expression of complement type 3 receptors, major histocompatibility complex class I and II antigens, and ED1 antigens. Following an intravenous injection of horseradish peroxidase (HRP), a large number of intraventricular macrophages were labeled suggesting enhanced leakage of the tracer from the blood vessels in the choroid plexus connective tissue stroma into the ventricular lumen. We suggest that increased production of NO in hypoxia is linked to the structural alteration of the choroid plexus, and along with VEGF, may lead to increased vascular permeability. Melatonin treatment reduced VEGF and NO levels as well as leakage of HRP suggesting its potential value in ameliorating damage in choroid plexus pathologies.
Figures
Similar articles
-
Cellular and vascular changes in the retina of neonatal rats after an acute exposure to hypoxia.Invest Ophthalmol Vis Sci. 2009 Nov;50(11):5364-74. doi: 10.1167/iovs.09-3552. Epub 2009 May 27. Invest Ophthalmol Vis Sci. 2009. PMID: 19474404
-
Increased vascular permeability and nitric oxide production in response to hypoxia in the pineal gland.J Pineal Res. 2007 Apr;42(4):338-49. doi: 10.1111/j.1600-079X.2007.00424.x. J Pineal Res. 2007. PMID: 17439550
-
Melatonin attenuates hypoxia-induced ultrastructural changes and increased vascular permeability in the developing hippocampus.Brain Pathol. 2008 Oct;18(4):533-47. doi: 10.1111/j.1750-3639.2008.00156.x. Epub 2008 Apr 15. Brain Pathol. 2008. PMID: 18422758 Free PMC article.
-
Origin, nature, and some functional considerations of intraventricular macrophages, with special reference to the epiplexus cells.Microsc Res Tech. 1998 Apr 1;41(1):43-56. doi: 10.1002/(SICI)1097-0029(19980401)41:1<43::AID-JEMT5>3.0.CO;2-V. Microsc Res Tech. 1998. PMID: 9550136 Review.
-
Unveiling the gut-brain axis: structural and functional analogies between the gut and the choroid plexus vascular and immune barriers.Semin Immunopathol. 2022 Nov;44(6):869-882. doi: 10.1007/s00281-022-00955-3. Epub 2022 Jul 21. Semin Immunopathol. 2022. PMID: 35861857 Free PMC article. Review.
Cited by
-
Choroid plexus and the blood-cerebrospinal fluid barrier in disease.Fluids Barriers CNS. 2020 May 6;17(1):35. doi: 10.1186/s12987-020-00196-2. Fluids Barriers CNS. 2020. PMID: 32375819 Free PMC article. Review.
-
VEGF/VEGFR-2 changes in frontal cortex, choroid plexus, and CSF after chronic obstructive hydrocephalus.J Neurol Sci. 2010 Sep 15;296(1-2):39-46. doi: 10.1016/j.jns.2010.06.012. J Neurol Sci. 2010. PMID: 20619858 Free PMC article.
-
Circadian System and Melatonin Hormone: Risk Factors for Complications during Pregnancy.Obstet Gynecol Int. 2015;2015:825802. doi: 10.1155/2015/825802. Epub 2015 Mar 2. Obstet Gynecol Int. 2015. PMID: 25821470 Free PMC article. Review.
-
The impact of hypoxia on blood-brain, blood-CSF, and CSF-brain barriers.J Appl Physiol (1985). 2021 Sep 1;131(3):977-985. doi: 10.1152/japplphysiol.00108.2020. Epub 2021 Jul 15. J Appl Physiol (1985). 2021. PMID: 34264124 Free PMC article. Review.
-
Melatonin in Retinal Physiology and Pathology: The Case of Age-Related Macular Degeneration.Oxid Med Cell Longev. 2016;2016:6819736. doi: 10.1155/2016/6819736. Epub 2016 Sep 5. Oxid Med Cell Longev. 2016. PMID: 27688828 Free PMC article. Review.
References
-
- Alonso M, Collado PS, Gonzalez‐Gallego J (2006) Melatonin inhibits the expression of the inducible isoform of nitric oxide synthase and nuclear factor kappa B activation in rat skeletal muscle. J Pineal Res 41:8–14. - PubMed
-
- Banker BQ, Larroche JC (1962) Periventricular leukomalacia of infancy. A form of neonatal anoxic encephalopathy. Arch Neurol 7:386–410. - PubMed
-
- Black SM, Bedolli MA, Martinez S, Bristow JD, Ferriero DM, Soifer SJ (1995) Expression of neuronal nitric oxide synthase corresponds to regions of selective vulnerability to hypoxia‐ischaemia in the developing rat brain. Neurobiol Dis 2:145–155. - PubMed
-
- Bolanos JP, Almeida A (1999) Roles of nitric oxide in brain hypoxia‐ischemia. Biochim Biophys Acta 411:415–436. - PubMed
-
- Breier G, Albrecht U, Sterrer S, Risau W (1992) Expression of vascular endothelial growth factor during embryonic angiogenesis and endothelial cell differentiation. Development 114:521–532. - PubMed
Publication types
MeSH terms
Substances
LinkOut - more resources
Full Text Sources
