. 2007;9(5):R69.
doi: 10.1186/bcr1777.

Mouse mammary tumors display Stat3 activation dependent on leukemia inhibitory factor signaling

Affiliations

Mouse mammary tumors display Stat3 activation dependent on leukemia inhibitory factor signaling

Ana Quaglino et al. Breast Cancer Res. 2007.

Abstract

Introduction: It has been demonstrated that leukemia inhibitory factor (LIF) induces epithelium apoptosis through Stat3 activation during mouse mammary gland involution. In contrast, it has been shown that this transcription factor is commonly activated in breast cancer cells, although what causes this effect remains unknown. Here we have tested the hypothesis that locally produced LIF can be responsible for Stat3 activation in mouse mammary tumors.

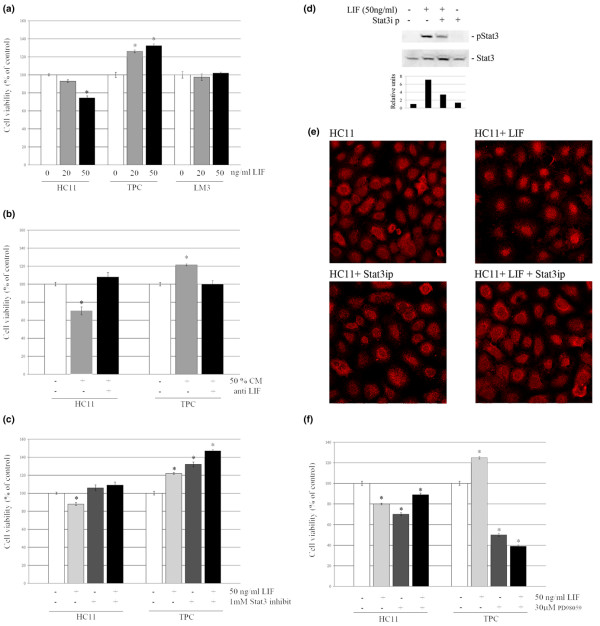
Methods: The studies were performed in different tumorigenic and non-tumorigenic mammary cells. The expression of LIF and LIF receptor was tested by RT-PCR analysis. In tumors, LIF and Stat3 proteins were analyzed by immunohistochemistry, whereas Stat3 and extracellular signal-regulated kinase (ERK)1/2 expression and phosphorylation were studied by Western blot analysis. A LIF-specific blocking antibody was used to determine whether this cytokine was responsible for Stat3 phosphorylation induced by conditioned medium. Specific pharmacological inhibitors (PD98059 and Stat3ip) that affect ERK1/2 and Stat3 activation were used to study their involvement in LIF-induced effects. To analyze cell survival, assays with crystal violet were performed.

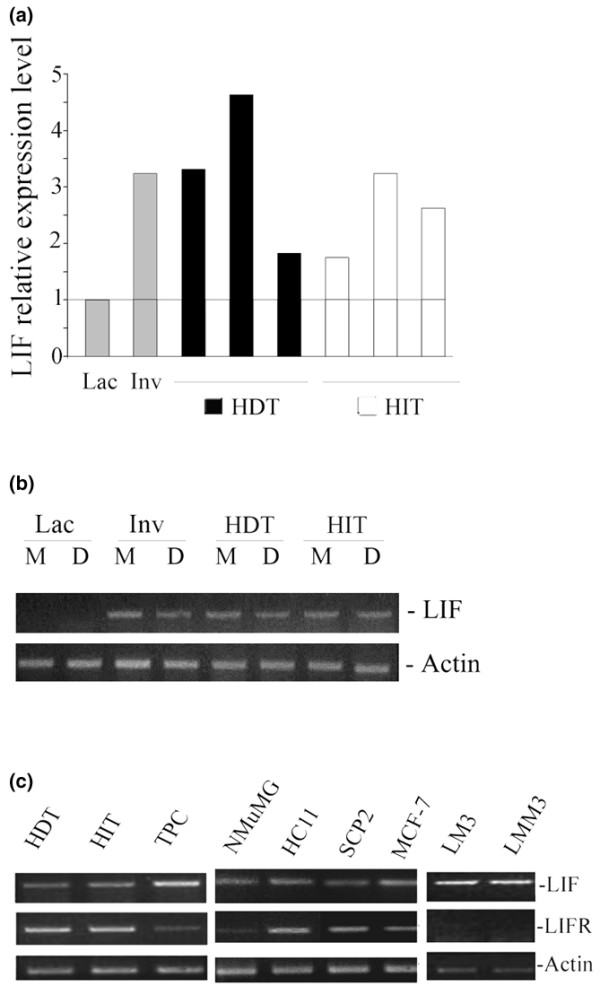
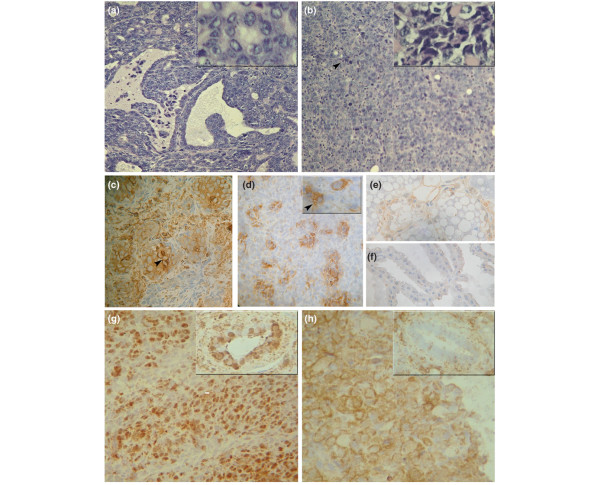
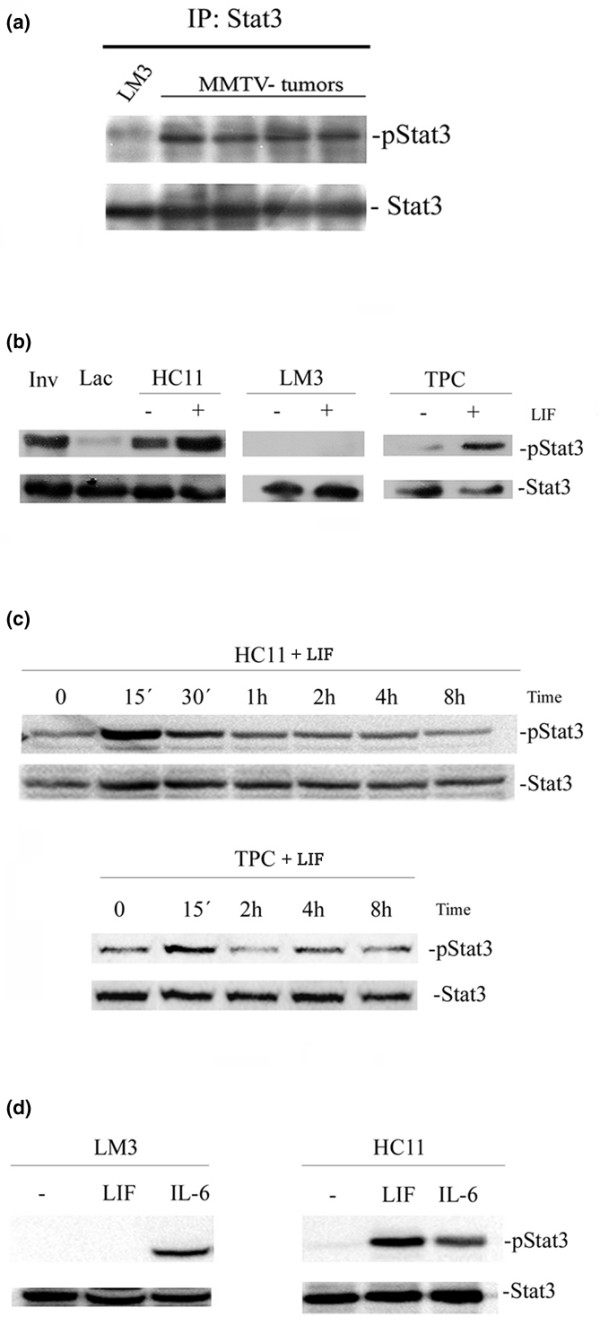
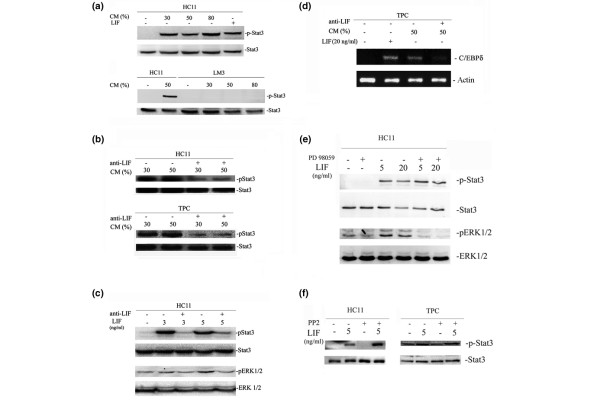
Results: High levels of LIF expression and activated Stat3 were found in mammary tumors growing in vivo and in their primary cultures. We found a single mouse mammary tumor cell line, LM3, that showed low levels of activated Stat3. Incidentally, these cells also showed very little expression of LIF receptor. This suggested that autocrine/paracrine LIF would be responsible for Stat3 activation in mouse mammary tumors. This hypothesis was confirmed by the ability of conditioned medium of mammary tumor primary cultures to induce Stat3 phosphorylation, activity that was prevented by pretreatment with LIF-blocking antibody. Besides, we found that LIF increased tumor cell viability. Interestingly, blocking Stat3 activation enhanced this effect in mammary tumor cells.

Conclusion: LIF is overexpressed in mouse mammary tumors, where it acts as the main Stat3 activator. Interestingly, the positive LIF effect on tumor cell viability is not dependent on Stat3 activation, which inhibits tumor cell survival as it does in normal mammary epithelium.


Figures

Figure 1
Figure 1
Expression of LIF and LIF receptor mRNA in mammary tumor cells. (a) Real-time PCR showing relative expression levels of leukemia inhibitory factor (LIF) in hormone-dependent (HDT) and hormone-independent (HIT) mouse mammary tumors compared with lactating (Lac) and 48-hour involuting (Inv) normal mammary glands. All samples were analyzed and normalized to actin expression in parallel in the same real-time PCR assay. (b) Ethidium bromide stained gel showing RT-PCR analysis of two different LIF splicing variants: LIF-M and LIF-D. (c) Ethidium bromide stained gel showing LIF and LIF-R expression by RT-PCR in HDT, HIT and in culture growing mammary cell lines: NMuMG, HC11, SCp2 (epithelial non-tumorigenic), MCF-7, LM3, LMM3 (tumorigenic mammary cell lines) and mammary tumor primary cultures (TPC).
Figure 2
Figure 2
Morphological and immunohistochemical analysis of MMTV(LA)-induced HIT and LM3 mammary tumors growing in vivo. (a, b) Hematoxylin/eosin-stained tumors. (a) Moderately differentiated hormone-independent tumors (HIT). Papillary formations into lumen of cystic ducts and less differentiated zones with small glandular structures. Original magnification ×100; inset ×400. (b) LM3 poorly differentiated adenocarcinoma with abundant infiltrated vascular stroma. Areas with sarcomatous appearance and apoptotic images (black arrowheads). Original magnification in (a, b) ×100; inset ×400. (c-f) Leukemia inhibitory factor (LIF) immunohistochemistry. (c) HIT: heterogenous and regular distribution mainly in poorly differentiated areas with cytoplasmic and nucleic positive staining; intense cytoplasmic staining increasing peripherally indicates a secretory pattern (arrowhead). (d) LM3 tumor: patchy LIF staining. Inset: positive cytoplasmic staining; the ill-defined cell membrane pattern with granular cytoplasmic staining indicates LIF secretion (arrowhead). (e) Involuting (48-hour) and (f) lactating mammary glands were used as positive and negative controls, respectively, for LIF staining. Original magnification in (c-f) 250×; inset: 400× (g, h) Stat3 (signal transduction and activators of transcription 3) immunohistochemistry. (g) HIT: stromal and predominantly epithelial positive nuclear staining in solid areas. Inset: stained nuclei were also seen in glandular regions. (h) LM3 tumor: intense cytoplasmic positive staining in stromal and epithelial cells. The inset shows a negative gland surrounded by positive stromal cells. Original magnification in (g, h) 250×; inset: 400×
Figure 3
Figure 3
Western blot analysis of phospho-Stat3 (pStat3) and Stat3. (a) Tumors growing in vivo: LM3 (lane 1) and different HIT transplants (lanes 2 to 5). (b-d) Cells growing in culture. (b) HC11, LM3 and tumor primary culture (TPC) cells treated with 80 ng/ml leukemia inhibitory factor (LIF) for 15 minutes; mammary glands at 48 hours of involution (Inv) and at fifth day of lactation (Lac) were used as positive and negative controls, respectively. (c) Time course of tyrosine phosphorylation of Stat3 (signal transduction and activators of transcription 3) in HC11 cells (upper panel) and TPC cells (lower panel) treated with 80 ng/ml LIF. (d) Tyrosine phosphorylation of Stat3 in HC11 and LM3 cells treated with LIF and IL-6 (both at 80 ng/ml) for 15 minutes.
Figure 4
Figure 4
Effect of tumor primary culture (TPC) conditioned medium (CM) and leukemia inhibitory factor (LIF)-neutralizing antibody. (a) Stat3 (signal transduction and activators of transcription 3) and phospho-Stat3 (p-Stat3) in HC11 and LM3 cells treated with increasing concentrations of CM (30%, 50% and 80%). (b) Stat3 and p-Stat3 levels in HC11 and TPC cells treated with CM that had been preincubated with or without LIF-neutralizing antibody. (c) Phosphorylation levels of Stat3 and extracellular signal-regulated kinase (ERK)1/2 in HC11 cells treated with LIF (3 and 5 ng/ml) preincubated with or without LIF-neutralizing antibody. (d) Expression of CCAAT-enhancer-binding protein (C/EBP)δ in TPC cells treated with CM with or without neutralizing antibody. (e) Phosphorylation of Stat3 and ERK1/2 in HC11 cells treated with LIF with or without the MAP kinase/ERK kinase inhibitor PD98059. (f) p-Stat3 and Stat3 in HC11 and TPC cells treated with LIF with or without the Src-specific inhibitor PP2. Experiments were repeated at least three times with similar results. No effect was observed on phosphorylation levels of either Stat3 or ERK1/2 when HC11 cells were treated with the PD98059 vehicle, dimethyl sulfoxide (data not shown).
Figure 5
Figure 5
Effect of LIF and CM on cell viability after 72 hours of treatment. Viability was assessed by crystal violet assays. (a) HC11, tumor primary culture (TPC) and LM3 cells were treated with leukemia inhibitory factor (LIF; 20 and 50 ng/ml). (b) HC11 and TPC cells were treated with 50% conditioned medium (CM) preincubated with or without LIF-neutralizing antibody. (c) HC11 and TPC cells were treated with 50 ng/ml LIF in the presence or absence of a Stat3 (signal transduction and activators of transcription 3) inhibitor peptide. (d, e) Effect of Stat3-specific inhibitory peptide (Stat3ip) on Stat3 phosphorylation levels (d) and nuclear translocation (e) induced by LIF. 400× (f) HC11 and TPC cells were treated with 50 ng/ml LIF in the presence or absence of PD98059. Data are percentages of internal control for each cell type (time 0) and are expressed as means ± SEM for four replicates. Experiments were repeated at least three times with similar results. Asterisk denotes statistical difference (P < 0.05) in a two-tailed Student's t test.

Similar articles

Cited by

References

    1. Gearing DP, Gough NM, King JA, Hilton DJ, Nicola NA, Simpson RJ, Nice EC, Kelso A, Metcalf D. Molecular cloning and expression of cDNA encoding a murine myeloid leukaemia inhibitory factor (LIF) EMBO J. 1987;6:3995–4002. - PMC - PubMed
    1. Taga T, Kishimoto T. Gp130 and the interleukin-6 family of cytokines. Annu Rev Immunol. 1997;15:797–819. doi: 10.1146/annurev.immunol.15.1.797. - DOI - PubMed
    1. Dhingra K, Sahin A, Emami K, Hortobagyi GN, Estrov Z. Expression of leukemia inhibitory factor and its receptor in breast cancer: a potential autocrine and paracrine growth regulatory mechanism. Breast Cancer Res Treat. 1998;48:165–174. doi: 10.1023/A:1005942923757. - DOI - PubMed
    1. Kellokumpu-Lehtinen P, Talpaz M, Harris D, Van Q, Kurzrock R, Estrov Z. Leukemia-inhibitory factor stimulates breast, kidney and prostate cancer cell proliferation by paracrine and autocrine pathways. Int J Cancer. 1996;66:515–519. doi: 10.1002/(SICI)1097-0215(19960516)66:4<515::AID-IJC15>3.0.CO;2-6. - DOI - PubMed
    1. Bamberger AM, Thuneke I, Schulte HM. Differential regulation of the human 'leukemia inhibitory factor' (LIF) promoter in T47D and MDA-MB 231 breast cancer cells. Breast Cancer Res Treat. 1998;47:153–161. doi: 10.1023/A:1005961403898. - DOI - PubMed

Publication types

MeSH terms

LinkOut - more resources