Dynamic transcription programs during ES cell differentiation towards mesoderm in serum versus serum-freeBMP4 culture
- PMID: 17925037
- PMCID: PMC2204012
- DOI: 10.1186/1471-2164-8-365
Dynamic transcription programs during ES cell differentiation towards mesoderm in serum versus serum-freeBMP4 culture
Abstract
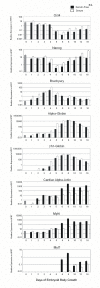
Background: Expression profiling of embryonic stem (ES) cell differentiation in the presence of serum has been performed previously. It remains unclear if transcriptional activation is dependent on complex growth factor mixtures in serum or whether this process is intrinsic to ES cells once the stem cell program has been inactivated. The aims of this study were to determine the transcriptional programs associated with the stem cell state and to characterize mesoderm differentiation between serum and serum-free culture.
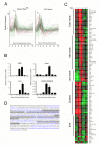
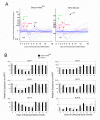
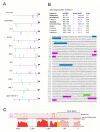
Results: ES cells were differentiated as embryoid bodies in 10% FBS or serum-free media containing BMP4 (2 ng/ml), and expression profiled using 47 K Illumina(R) Sentrix arrays. Statistical methods were employed to define gene sets characteristic of stem cell, epiblast and primitive streak programs. Although the initial differentiation profile was similar between the two culture conditions, cardiac gene expression was inhibited in serum whereas blood gene expression was enhanced. Also, expression of many members of the Kruppel-like factor (KLF) family of transcription factors changed dramatically during the first few days of differentiation. KLF2 and KLF4 co-localized with OCT4 in a sub-nuclear compartment of ES cells, dynamic changes in KLF-DNA binding activities occurred upon differentiation, and strong bio-informatic evidence for direct regulation of many stem cell genes by KLFs was found.
Conclusion: Down regulation of stem cell genes and activation of epiblast/primitive streak genes is similar in serum and defined media, but subsequent mesoderm differentiation is strongly influenced by the composition of the media. In addition, KLF family members are likely to be important regulators of many stem cell genes.
Figures


Similar articles
-
In vitro differentiation of murine embryonic stem cells toward a renal lineage.Differentiation. 2007 Jun;75(5):337-49. doi: 10.1111/j.1432-0436.2006.00149.x. Epub 2007 Feb 5. Differentiation. 2007. PMID: 17286599
-
Analysis of the temporal and concentration-dependent effects of BMP-4, VEGF, and TPO on development of embryonic stem cell-derived mesoderm and blood progenitors in a defined, serum-free media.Exp Hematol. 2008 Sep;36(9):1186-98. doi: 10.1016/j.exphem.2008.04.003. Epub 2008 Jun 11. Exp Hematol. 2008. PMID: 18550259
-
Differentiation of human embryonic stem cells in serum-free medium reveals distinct roles for bone morphogenetic protein 4, vascular endothelial growth factor, stem cell factor, and fibroblast growth factor 2 in hematopoiesis.Stem Cells. 2007 Sep;25(9):2206-14. doi: 10.1634/stemcells.2006-0713. Epub 2007 Jun 7. Stem Cells. 2007. PMID: 17556598
-
Developing reagents and conditions to induce mesoderm subsets from ES cells.Cell Stem Cell. 2007 Dec 13;1(6):603-4. doi: 10.1016/j.stem.2007.11.005. Cell Stem Cell. 2007. PMID: 18371401 Review.
-
Transcriptional regulation by coactivators in embryonic stem cells.Trends Cell Biol. 2012 Jun;22(6):292-8. doi: 10.1016/j.tcb.2012.04.002. Epub 2012 May 7. Trends Cell Biol. 2012. PMID: 22572610 Free PMC article. Review.
Cited by
-
Spatiotemporal clustering of the epigenome reveals rules of dynamic gene regulation.Genome Res. 2013 Feb;23(2):352-64. doi: 10.1101/gr.144949.112. Epub 2012 Oct 2. Genome Res. 2013. PMID: 23033340 Free PMC article.
-
Optimization of culture condition of human bone marrow stromal cells in terms of purification, proliferation, and pluripotency.In Vitro Cell Dev Biol Anim. 2014 Oct;50(9):822-30. doi: 10.1007/s11626-014-9778-6. Epub 2014 Jun 17. In Vitro Cell Dev Biol Anim. 2014. PMID: 24934232
-
Expression of Kruppel-like factor KLF4 in mouse hair follicle stem cells contributes to cutaneous wound healing.PLoS One. 2012;7(6):e39663. doi: 10.1371/journal.pone.0039663. Epub 2012 Jun 20. PLoS One. 2012. PMID: 22745808 Free PMC article.
-
ERK1 and ERK2 regulate embryonic stem cell self-renewal through phosphorylation of Klf4.Nat Struct Mol Biol. 2012 Feb 5;19(3):283-90. doi: 10.1038/nsmb.2217. Nat Struct Mol Biol. 2012. PMID: 22307056
-
The acceleration of cardiomyogenesis in embryonic stem cells in vitro by serum depletion does not increase the number of developed cardiomyocytes.PLoS One. 2017 Mar 13;12(3):e0173140. doi: 10.1371/journal.pone.0173140. eCollection 2017. PLoS One. 2017. PMID: 28288171 Free PMC article.
References
-
- Vittet D, Prandini MH, Berthier R, Schweitzer A, Martin-Sisteron H, Uzan G, Dejana E. Embryonic stem cells differentiate in vitro to endothelial cells through successive maturation steps. Blood. 1996;88:3424–3431. - PubMed
-
- Rohwedel J, Maltsev V, Bober E, Arnold HH, Hescheler J, Wobus AM. Muscle cell differentiation of embryonic stem cells reflects myogenesis in vivo: developmentally regulated expression of myogenic determination genes and functional expression of ionic currents. Dev Biol. 1994;164:87–101. doi: 10.1006/dbio.1994.1182. - DOI - PubMed
Publication types
MeSH terms
Substances
LinkOut - more resources
Full Text Sources
Other Literature Sources

