. 2007 Oct 16;104(42):16510-5.
doi: 10.1073/pnas.0703665104. Epub 2007 Oct 9.

Longitudinally propagating traveling waves of the mammalian tectorial membrane

Affiliations

Longitudinally propagating traveling waves of the mammalian tectorial membrane

Roozbeh Ghaffari et al. Proc Natl Acad Sci U S A. .

Abstract

Sound-evoked vibrations transmitted into the mammalian cochlea produce traveling waves that provide the mechanical tuning necessary for spectral decomposition of sound. These traveling waves of motion that have been observed to propagate longitudinally along the basilar membrane (BM) ultimately stimulate the mechano-sensory receptors. The tectorial membrane (TM) plays a key role in this process, but its mechanical function remains unclear. Here we show that the TM supports traveling waves that are an intrinsic feature of its visco-elastic structure. Radial forces applied at audio frequencies (2-20 kHz) to isolated TM segments generate longitudinally propagating waves on the TM with velocities similar to those of the BM traveling wave near its best frequency place. We compute the dynamic shear storage modulus and shear viscosity of the TM from the propagation velocity of the waves and show that segments of the TM from the basal turn are stiffer than apical segments are. Analysis of loading effects of hair bundle stiffness, the limbal attachment of the TM, and viscous damping in the subtectorial space suggests that TM traveling waves can occur in vivo. Our results show the presence of a traveling wave mechanism through the TM that can functionally couple a significant longitudinal extent of the cochlea and may interact with the BM wave to greatly enhance cochlear sensitivity and tuning.


Conflict of interest statement

The authors declare no conflict of interest.

Figures
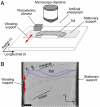
Fig. 1.
Fig. 1.
Suspended TM segment in a wave chamber. (A) Schematic of TM segment suspended between two supports (not to scale). Double-headed arrow indicates sinusoidal displacement of vibrating support at audio frequencies. Radial displacement of the TM was tracked at audio frequencies by using stroboscopic illumination (see Materials and Methods). (B) Image of TM segment taken with a light microscope. (Scale bar, 50 μm.) Displacement and phase of propagating motion were tracked at several points along the TM in the region that normally overlies the hair bundles. Marginal and limbal boundaries of the TM are indicated. The two schematic waveforms pasted on the image are displacement snapshots at sequential instants (φ1, φ2) illustrating typical TM deformations. Displacement amplitudes were exaggerated to show the wave-like nature of the motion.
Fig. 2.
Fig. 2.
Traveling waves along isolated TM segments. (A) TM radial displacement vs. longitudinal distance in response to 15-kHz stimulation. Radial displacement (r) is plotted as a function of longitudinal distance (x) at two instants separated by 1/4 cycle for a TM segment from the upper basal turn. Solid lines represent the equation r = 0.13e−(x−30)/237cos(2π(x − 30)/350 − φ), with x and r in micrometers and φ = 0, π/2 radians. Longitudinal distance was measured relative to a point on the TM ≈30 μm from the edge of vibrating support. (B) Phase vs. longitudinal distance for stimulus frequencies 2–18 kHz of the basal TM segment from A. Phase is plotted relative to a 30-μm point on the TM. Phases decreased monotonically with distance and became steeper with increasing frequency. (C) Phase vs. stimulus frequency at a location on the surface of the TM ≈250 μm from vibrating support. Each symbol represents phase lag measured relative to a 30-μm point on the TM. Apical TMs (red; n = 25 measurements) accumulated more phase lag than basal TMs (blue; n = 22 measurements) at a given stimulus frequency. The entire data set represents measurements across six TM preparations (three basal and three apical TMs).
Fig. 3.
Fig. 3.
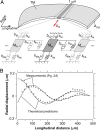
Distributed impedance model of the TM. (A) (Upper) Schematic highlighting a 1-μm longitudinal section (d) of the TM (dark gray) with rectangular cross-sectional area, ATM. Vibrating support can generate radial motion of this TM section with a velocity of Um through longitudinal coupling. (Lower) Mechanical circuit representation of TM section consisting of a mass (Mm) coupled to adjacent sections (Mm−1, Mm+1) by viscous (bm, bm−1) and elastic (km, km−1) components. The effective mass of each TM section included the mass of the fluid layers above and below the TM. Effect of damping in the fluid layer was investigated by adding a dashpot (bbl) between each mass and ground. Effects of cochlear loads: viscous damping in the subtectorial space (bsts), hair bundle stiffness (khb), and the elastic effect of the limbal attachment (ksl) were investigated by adding a dashpot and two springs between each mass and ground. (B) Comparison of TM wave measurements in the wave chamber to theoretical predictions of the distributed impedance model. Symbols (+ and ○) denote motion measurements of the upper basal TM segment from Fig. 2A. Lines represent least-squares fits of the theoretical predictions to these experimental results. The best fit values of shear storage modulus, G′, and shear viscosity, η, applied in the model across multiple frequencies for this TM were 30 kPa and 0.13 Pa·s, respectively. Velocities at the extreme longitudinal ends of the TM segment were constrained in the model as they were by the supports in the TM wave experiments.
Fig. 4.
Fig. 4.
Propagation velocity of TM traveling waves. The circles represent the median values of wave propagation velocity, νs, measured across multiple frequencies for basal (blue; n = 7 TM preparations) and apical (red; n = 4 TM preparations) segments. Interquartile ranges are represented with vertical lines. Lines represent model predictions of νs vs. frequency generated from the average dimensions of basal and apical TM segments and from material property estimates (G′ and η) of these segments. Typical values of G′ and η for basal (G′ = 40 kPa; η = 0.33 Pa·s) and apical (G′ = 16 kPa; η = 0.18 Pa·s) TM segments were applied to estimate the frequency dependence of νs in the model.

References

    1. Kössl M, Russell IJ. Proc Natl Acad Sci USA. 1995;92:276–279. - PMC - PubMed
    1. Dallos P. In: The Cochlea. Dallos P, Popper AN, Fay RR, editors. New York: Springer; 1996. pp. 1–43.
    1. von Békésy G. Experiments in Hearing. New York: McGraw–Hill; 1960.
    1. Hudspeth AJ. Science. 1985;230:745–752. - PubMed
    1. McGuirt WT, Prasad SD, Griffith AJ, Kunst H, Green GE, Shpargel KB, Runge C, Huybrechts C, Mueller RF, et al. Nat Genet. 1999;23:413–419. - PubMed

Publication types

LinkOut - more resources