

Targeting Notch signaling in autoimmune and lymphoproliferative disease
- PMID: 17925488
- PMCID: PMC2200835
- DOI: 10.1182/blood-2007-05-087353
Targeting Notch signaling in autoimmune and lymphoproliferative disease
Abstract
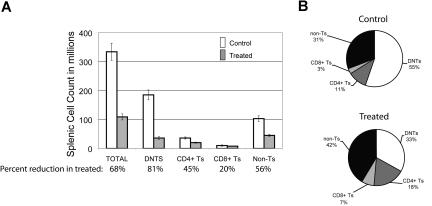
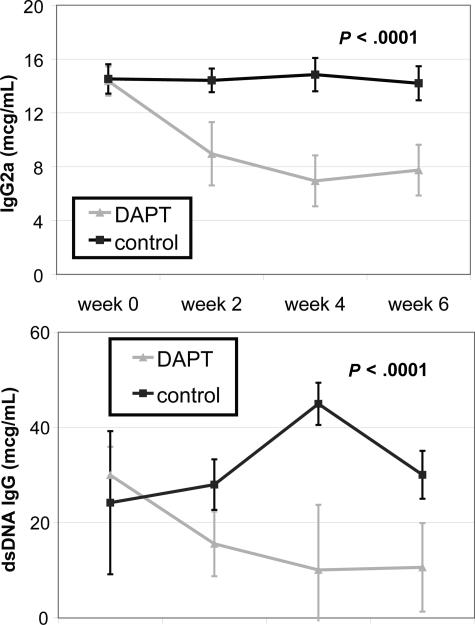
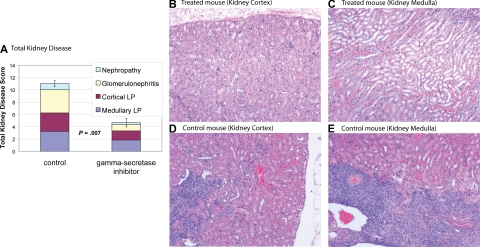
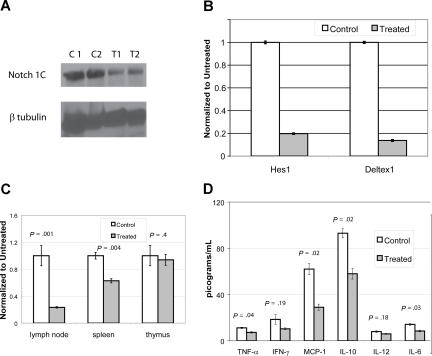
Patients with autoimmune lymphoproliferative syndrome (ALPS) and systemic lupus erythematosis (SLE) have T-cell dysregulation and produce abnormal, activated T lymphocytes and an atypical peripheral T-cell population, termed double negative T cells (DNTs). T-cell functions, including DNT transition in T-cell development and T-cell activation, are critically dependent on Notch signaling. We hypothesized that inhibiting Notch signaling would be effective in ALPS and SLE by reducing the production of abnormal DNTs and by blocking aberrant T-cell activation. We tested this hypothesis using murine models of ALPS and SLE. Mice were randomized to treatment with the notch pathway inhibitor (gamma-secretase inhibitor), N-S-phenyl-glycine-t-butyl ester (DAPT), or vehicle control. Response to treatment was assessed by measurement of DNTs in blood and lymphoid tissue, by monitoring lymph node and spleen size with ultrasound, by quantifying cytokines by bead-array, by ELISA for total IgG and anti-double-stranded DNA (dsDNA) specific antibodies, and by histopathologic assessment for nephritis. We found a profound and statistically significant decrease in all disease parameters, comparing DAPT-treated mice to controls. Using a novel dosing schema, we avoided the reported toxicities of gamma-secretase inhibitors. Inhibiting the Notch signaling pathway may thus present an effective, novel, and well-tolerated treatment for autoimmune and lymphoproliferative diseases.
Figures


Similar articles
-
Rapamycin improves lymphoproliferative disease in murine autoimmune lymphoproliferative syndrome (ALPS).Blood. 2006 Sep 15;108(6):1965-71. doi: 10.1182/blood-2006-01-010124. Epub 2006 Jun 6. Blood. 2006. PMID: 16757690 Free PMC article.
-
Arsenic trioxide: A promising novel therapeutic agent for lymphoproliferative and autoimmune syndromes in MRL/lpr mice.Blood. 2006 Dec 15;108(13):3967-75. doi: 10.1182/blood-2006-04-020610. Epub 2006 Aug 22. Blood. 2006. PMID: 16926289
-
Effects of FTY720 in MRL-lpr/lpr mice: therapeutic potential in systemic lupus erythematosus.J Rheumatol. 2002 Apr;29(4):707-16. J Rheumatol. 2002. PMID: 11950011
-
Double-Negative T (DNT) Cells in Patients with Systemic Lupus Erythematosus.Biomedicines. 2024 Jan 12;12(1):166. doi: 10.3390/biomedicines12010166. Biomedicines. 2024. PMID: 38255272 Free PMC article. Review.
-
Notch and inflammatory T-cell response: new developments and challenges.Immunotherapy. 2011 Nov;3(11):1353-66. doi: 10.2217/imt.11.126. Immunotherapy. 2011. PMID: 22053886 Free PMC article. Review.
Cited by
-
The transcriptional repressor Hes1 attenuates inflammation by regulating transcription elongation.Nat Immunol. 2016 Aug;17(8):930-7. doi: 10.1038/ni.3486. Epub 2016 Jun 20. Nat Immunol. 2016. PMID: 27322654 Free PMC article.
-
How I treat autoimmune lymphoproliferative syndrome.Blood. 2011 Nov 24;118(22):5741-51. doi: 10.1182/blood-2011-07-325217. Epub 2011 Sep 1. Blood. 2011. PMID: 21885601 Free PMC article. Review.
-
Toward a general predictive QSAR model for gamma-secretase inhibitors.Mol Divers. 2013 Aug;17(3):421-34. doi: 10.1007/s11030-013-9441-2. Epub 2013 Apr 24. Mol Divers. 2013. PMID: 23612850
-
Strategies of Targeting Inflammasome in the Treatment of Systemic Lupus Erythematosus.Front Immunol. 2022 May 18;13:894847. doi: 10.3389/fimmu.2022.894847. eCollection 2022. Front Immunol. 2022. PMID: 35664004 Free PMC article. Review.
-
Notch in the kidney: development and disease.J Pathol. 2012 Jan;226(2):394-403. doi: 10.1002/path.2967. Epub 2011 Aug 24. J Pathol. 2012. PMID: 21952830 Free PMC article. Review.
References
-
- Bleesing JJ, Brown MR, Novicio C, et al. A composite picture of TcR alpha/beta(+) CD4(-)CD8(-) T Cells (alpha/beta-DNTCs) in humans with autoimmune lymphoproliferative syndrome. Clin Immunol. 2002;104:21–30. - PubMed
-
- Dean GS, Anand A, Blofeld A, Isenberg DA, Lydyard PM. Characterization of CD3+ CD4- CD8- (double negative) T cells in patients with systemic lupus erythematosus: production of IL-4. Lupus. 2002;11:501–507. - PubMed
-
- Xue C, Lan-Lan W, Bei C, Jie C, Wei-Hua F. Abnormal Fas/FasL and caspase-3-mediated apoptotic signaling pathways of T lymphocyte subset in patients with systemic lupus erythematosus. Cell Immunol. 2006;239:121–128. - PubMed
-
- Teachey DT, Manno CS, Axsom KM, et al. Unmasking Evans syndrome: T-cell phenotype and apoptotic response reveal autoimmune lymphoproliferative syndrome (ALPS). Blood. 2005;105:2443–2448. - PubMed
Publication types
MeSH terms
Substances
Grants and funding
LinkOut - more resources
Full Text Sources
Other Literature Sources
Medical
Molecular Biology Databases
Miscellaneous
