

Biological stoichiometry in human cancer
- PMID: 17925876
- PMCID: PMC2000353
- DOI: 10.1371/journal.pone.0001028
Biological stoichiometry in human cancer
Abstract
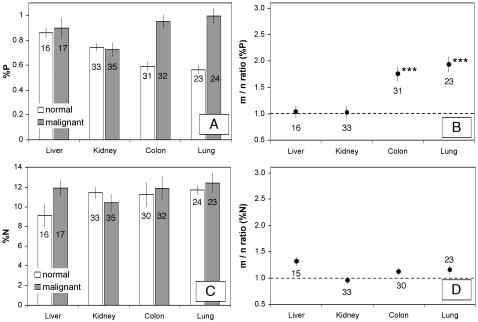
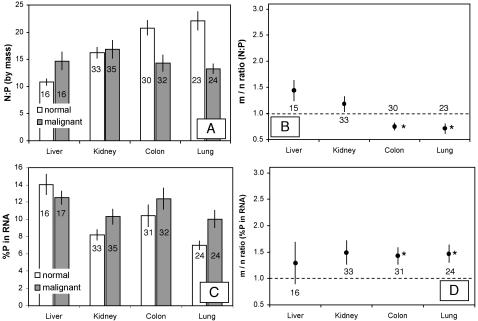
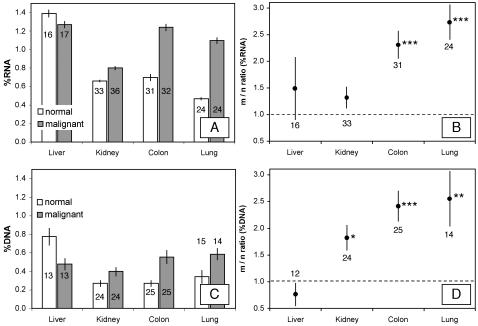
Background: A growing tumor in the body can be considered a complex ecological and evolutionary system. A new eco-evolutionary hypothesis (the "Growth Rate Hypothesis", GRH) proposes that tumors have elevated phosphorus (P) demands due to increased allocation to P-rich nucleic acids, especially ribosomal RNA, to meet the protein synthesis demands of accelerated proliferation.
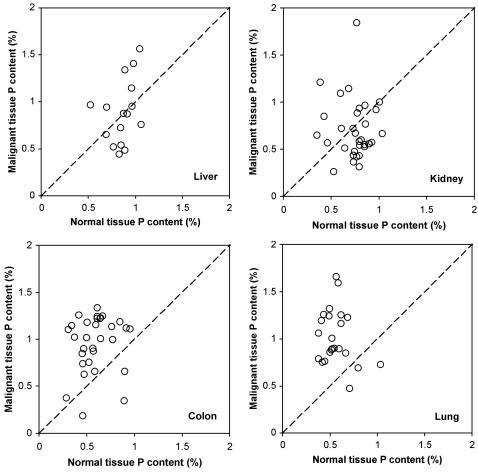
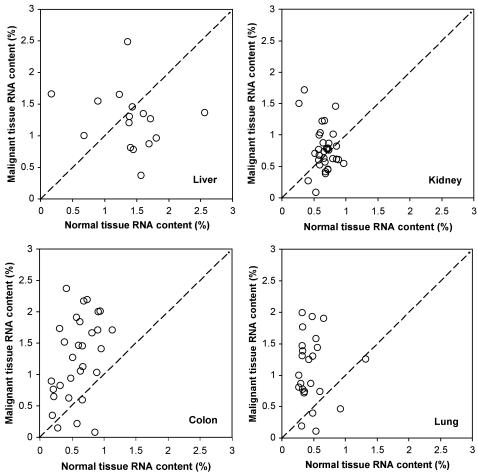
Methodology/principal findings: We determined the elemental (C, N, P) and nucleic acid contents of paired malignant and normal tissues from colon, lung, liver, or kidney for 121 patients. Consistent with the GRH, lung and colon tumors were significantly higher (by approximately two-fold) in P content (fraction of dry weight) and RNA content and lower in nitrogen (N):P ratio than paired normal tissue, and P in RNA contributed a significantly larger fraction of total biomass P in malignant relative to normal tissues. Furthermore, patient-specific differences for %P between malignant and normal tissues were positively correlated with such differences for %RNA, both for the overall data and within three of the four organ sites. However, significant differences in %P and %RNA between malignant and normal tissues were not seen in liver and kidney and, overall, RNA contributed only approximately 11% of total tissue P content.
Conclusions/significance: Data for lung and colon tumors provide support for the GRH in human cancer. The two-fold amplification of P content in colon and lung tumors may set the stage for potential P-limitation of their proliferation, as such differences often do for rapidly growing biota in ecosystems. However, data for kidney and liver do not support the GRH. To account for these conflicting observations, we suggest that local environments in some organs select for neoplastic cells bearing mutations increasing cell division rate ("r-selected," as in colon and lung) while conditions elsewhere may select for reduced mortality rate ("K-selected," as in liver and kidney).
Conflict of interest statement
Figures
Similar articles
-
Revisiting the growth rate hypothesis: Towards a holistic stoichiometric understanding of growth.Ecol Lett. 2022 Oct;25(10):2324-2339. doi: 10.1111/ele.14096. Epub 2022 Sep 11. Ecol Lett. 2022. PMID: 36089849 Free PMC article. Review.
-
Testing the growth rate hypothesis in vascular plants with above- and below-ground biomass.PLoS One. 2012;7(3):e32162. doi: 10.1371/journal.pone.0032162. Epub 2012 Mar 13. PLoS One. 2012. PMID: 22427823 Free PMC article.
-
Nucleic acid content in crustacean zooplankton: bridging metabolic and stoichiometric predictions.PLoS One. 2014 Jan 21;9(1):e86493. doi: 10.1371/journal.pone.0086493. eCollection 2014. PLoS One. 2014. PMID: 24466118 Free PMC article.
-
AKT-1, -2, and -3 are expressed in both normal and tumor tissues of the lung, breast, prostate, and colon.Clin Cancer Res. 2001 Aug;7(8):2475-9. Clin Cancer Res. 2001. PMID: 11489829
-
Optimization of biomass composition explains microbial growth-stoichiometry relationships.Am Nat. 2011 Feb;177(2):E29-42. doi: 10.1086/657684. Am Nat. 2011. PMID: 21460549
Cited by
-
Phosphate and Cellular Senescence.Adv Exp Med Biol. 2022;1362:55-72. doi: 10.1007/978-3-030-91623-7_7. Adv Exp Med Biol. 2022. PMID: 35288873 Free PMC article.
-
Breast Cancer and Bone Mineral Density in a U.S. Cohort of Middle-Aged Women: Associations with Phosphate Toxicity.Cancers (Basel). 2023 Oct 21;15(20):5093. doi: 10.3390/cancers15205093. Cancers (Basel). 2023. PMID: 37894460 Free PMC article.
-
In Vivo Molecular Electron Paramagnetic Resonance-Based Spectroscopy and Imaging of Tumor Microenvironment and Redox Using Functional Paramagnetic Probes.Antioxid Redox Signal. 2018 May 20;28(15):1365-1377. doi: 10.1089/ars.2017.7329. Epub 2017 Dec 20. Antioxid Redox Signal. 2018. PMID: 29132215 Free PMC article. Review.
-
The Roles of Sodium-Independent Inorganic Phosphate Transporters in Inorganic Phosphate Homeostasis and in Cancer and Other Diseases.Int J Mol Sci. 2020 Dec 6;21(23):9298. doi: 10.3390/ijms21239298. Int J Mol Sci. 2020. PMID: 33291240 Free PMC article. Review.
-
Prospective Evaluation of Unprocessed Core Needle Biopsy DNA and RNA Yield from Lung, Liver, and Kidney Tumors: Implications for Cancer Genomics.Anal Cell Pathol (Amst). 2018 Dec 10;2018:2898962. doi: 10.1155/2018/2898962. eCollection 2018. Anal Cell Pathol (Amst). 2018. PMID: 30652067 Free PMC article.
References
-
- Clegg LX, Li FP, Hankey BF, Chu K, Edwards BK. Cancer survival among U.S. whites and minorities: a SEER (Surveillance, Epidemiology, and End Results) population-based study. Arch Intern Med. 2002;162:1985–1993. - PubMed
-
- Merlo LMF, Pepper JW, Reid BJ, Maley CC. Cancer as an evolutionary and ecological process. Nat Rev Cancer. 2006;6:924–935. - PubMed
-
- Greaves M. Darwinian medicine: a case for cancer. Nature Reviews Cancer. 2007;7:213–221. - PubMed
-
- Mutter GL, et al. Molecular identification of latent precancers in histologically normal endometrium. Cancer Res. 2001;61:4311–4314. - PubMed
-
- Sterner RW, Elser JJ. Princeton, N.J.: Princeton University Press; 2002. Ecological Stoichiometry: The Biology of Elements from Molecules to the Biosphere.
Publication types
MeSH terms
Substances
Grants and funding
LinkOut - more resources
Full Text Sources
