

Transcriptional regulatory network for sexual differentiation in fission yeast
- PMID: 17927811
- PMCID: PMC2246291
- DOI: 10.1186/gb-2007-8-10-r217
Transcriptional regulatory network for sexual differentiation in fission yeast
Abstract
Background: Changes in gene expression are hallmarks of cellular differentiation. Sexual differentiation in fission yeast (Schizosaccharomyces pombe) provides a model system for gene expression programs accompanying and driving cellular specialization. The expression of hundreds of genes is modulated in successive waves during meiosis and sporulation in S. pombe, and several known transcription factors are critical for these processes.
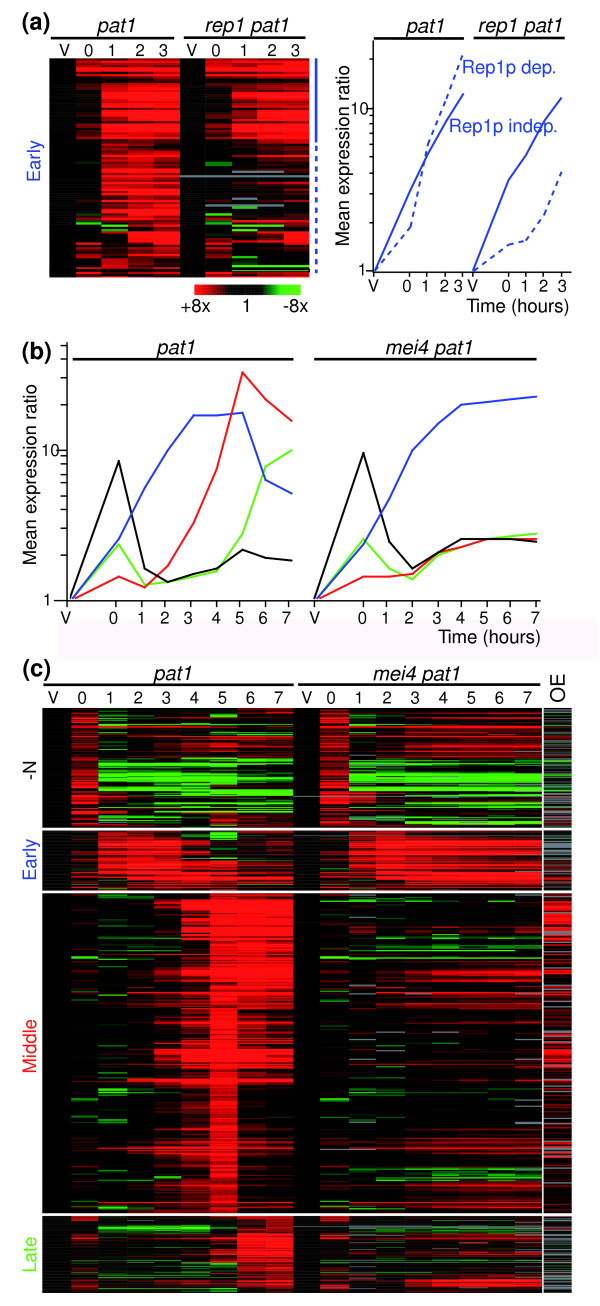
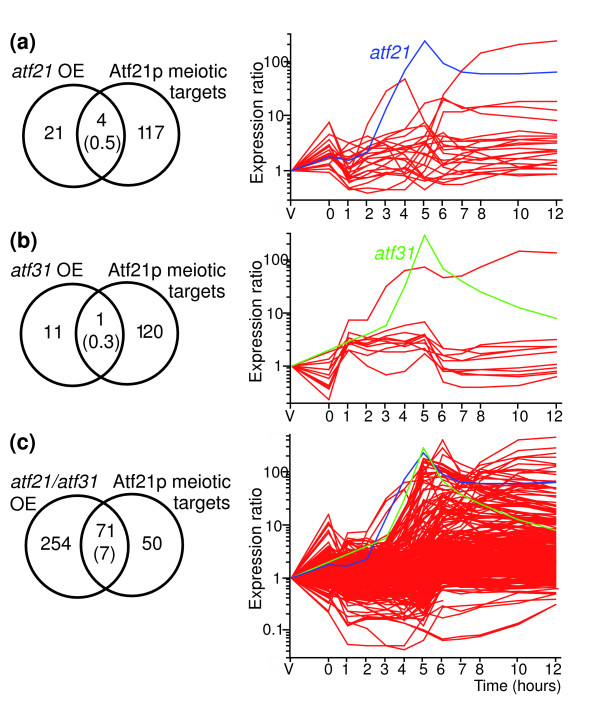
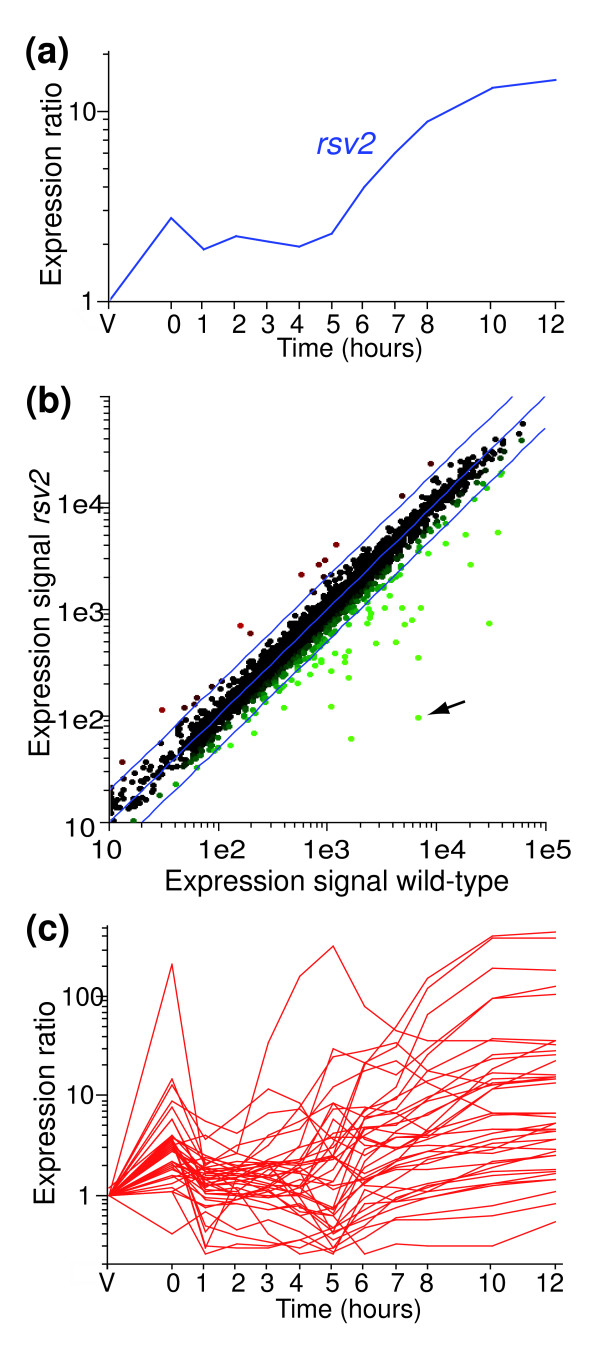
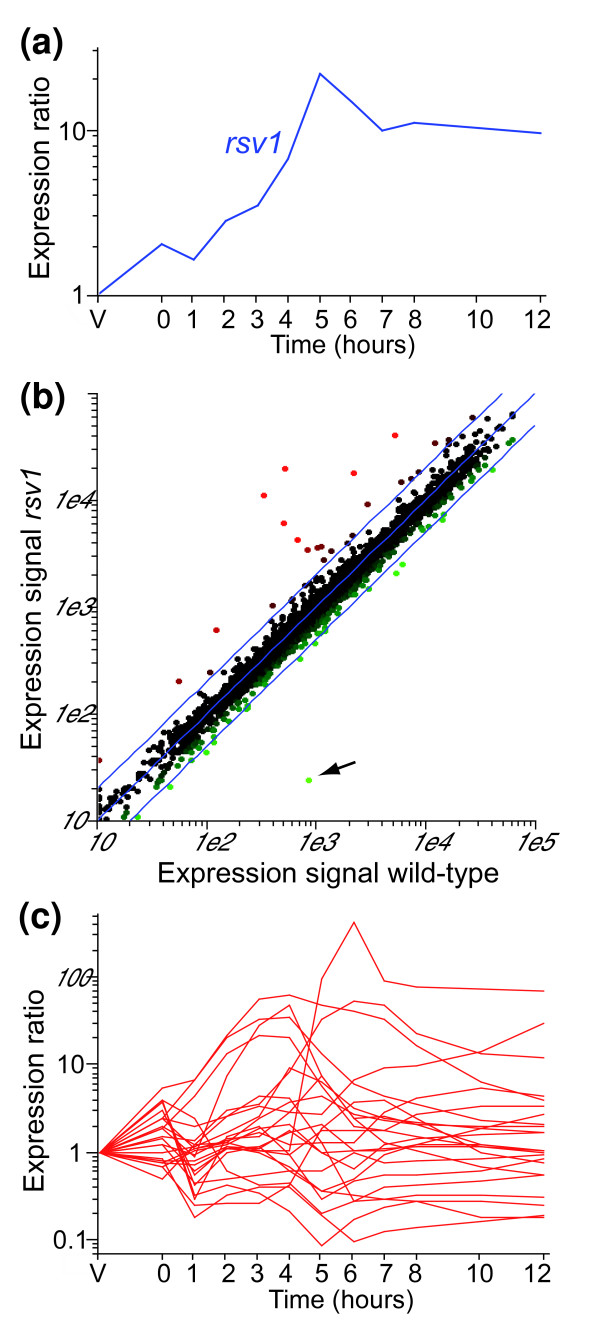
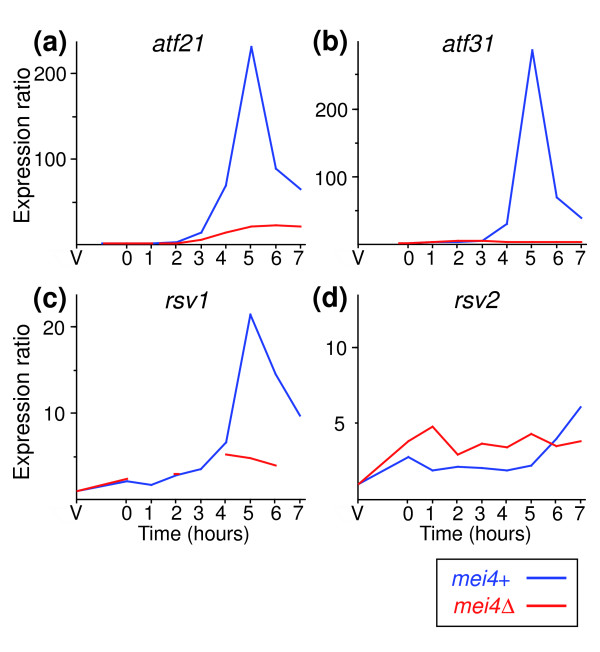
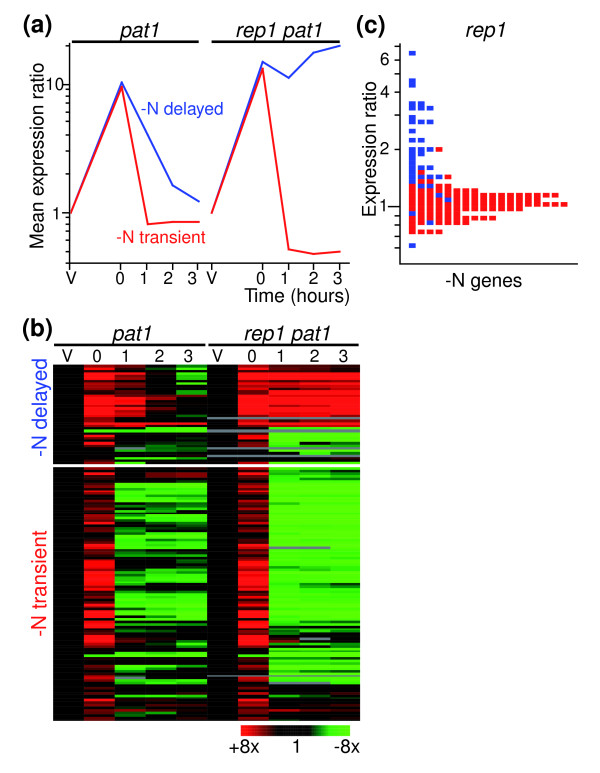
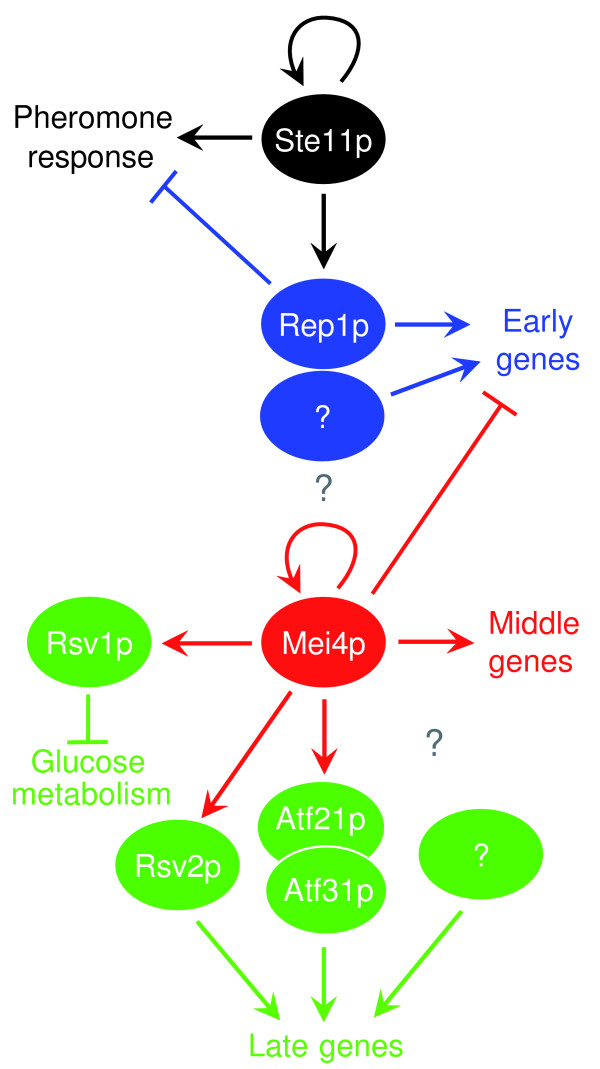
Results: We used DNA microarrays to investigate meiotic gene regulation by examining transcriptomes after genetic perturbations (gene deletion and/or overexpression) of rep1, mei4, atf21 and atf31, which encode known transcription factors controlling sexual differentiation. This analysis reveals target genes at a genome-wide scale and uncovers combinatorial control by Atf21p and Atf31p. We also studied two transcription factors not previously implicated in sexual differentiation whose meiotic induction depended on Mei4p: Rsv2p induces stress-related genes during spore formation, while Rsv1p represses glucose-metabolism genes. Our data further reveal negative feedback interactions: both Rep1p and Mei4p not only activate specific gene expression waves (early and middle genes, respectively) but are also required for repression of genes induced in the previous waves (Ste11p-dependent and early genes, respectively).
Conclusion: These data give insight into regulatory principles controlling the extensive gene expression program driving sexual differentiation and highlight sophisticated interactions and combinatorial control among transcription factors. Besides triggering simultaneous expression of gene waves, transcription factors also repress genes in the previous wave and induce other factors that in turn regulate a subsequent wave. These dependencies ensure an ordered and timely succession of transcriptional waves during cellular differentiation.
Figures
Similar articles
-
Functional significance of nuclear export and mRNA binding of meiotic regulator Spo5 in fission yeast.BMC Microbiol. 2014 Jul 15;14:188. doi: 10.1186/1471-2180-14-188. BMC Microbiol. 2014. PMID: 25023750 Free PMC article.
-
The transcriptional program of meiosis and sporulation in fission yeast.Nat Genet. 2002 Sep;32(1):143-7. doi: 10.1038/ng951. Epub 2002 Aug 5. Nat Genet. 2002. PMID: 12161753
-
Global roles of Ste11p, cell type, and pheromone in the control of gene expression during early sexual differentiation in fission yeast.Proc Natl Acad Sci U S A. 2006 Oct 17;103(42):15517-22. doi: 10.1073/pnas.0603403103. Epub 2006 Oct 9. Proc Natl Acad Sci U S A. 2006. PMID: 17032641 Free PMC article.
-
Regulation of sexual differentiation initiation in Schizosaccharomyces pombe.Biosci Biotechnol Biochem. 2024 Apr 22;88(5):475-492. doi: 10.1093/bbb/zbae019. Biosci Biotechnol Biochem. 2024. PMID: 38449372 Review.
-
Meiotic recombination and chromosome segregation in Schizosaccharomyces pombe.Proc Natl Acad Sci U S A. 2001 Jul 17;98(15):8395-402. doi: 10.1073/pnas.121005598. Proc Natl Acad Sci U S A. 2001. PMID: 11459981 Free PMC article. Review.
Cited by
-
Repression of meiotic genes by antisense transcription and by Fkh2 transcription factor in Schizosaccharomyces pombe.PLoS One. 2012;7(1):e29917. doi: 10.1371/journal.pone.0029917. Epub 2012 Jan 6. PLoS One. 2012. PMID: 22238674 Free PMC article.
-
A homeobox protein Phx1 regulates long-term survival and meiotic sporulation in Schizosaccharomyces pombe.BMC Microbiol. 2012 May 30;12:86. doi: 10.1186/1471-2180-12-86. BMC Microbiol. 2012. PMID: 22646093 Free PMC article.
-
Translesion synthesis polymerases contribute to meiotic chromosome segregation and cohesin dynamics in Schizosaccharomycespombe.J Cell Sci. 2020 May 22;133(10):jcs238709. doi: 10.1242/jcs.238709. J Cell Sci. 2020. PMID: 32317395 Free PMC article.
-
Clustered regulatory elements at nucleosome-depleted regions punctuate a constant nucleosomal landscape in Schizosaccharomyces pombe.BMC Genomics. 2013 Nov 21;14(1):813. doi: 10.1186/1471-2164-14-813. BMC Genomics. 2013. PMID: 24256300 Free PMC article.
-
Functional significance of nuclear export and mRNA binding of meiotic regulator Spo5 in fission yeast.BMC Microbiol. 2014 Jul 15;14:188. doi: 10.1186/1471-2180-14-188. BMC Microbiol. 2014. PMID: 25023750 Free PMC article.
References
-
- Shimoda C, Nakamura T. Control of late meiosis and ascospore formation. In: Egel R, editor. The Molecular Biology of Schizosaccharomyces pombe. Heidelberg: Springer-Verlag; 2004. pp. 311–327.
-
- Yamamoto M. Initiation of meiosis. In: Egel R, editor. The Molecular Biology of Schizosaccharomyces pombe. Heidelberg: Springer-Verlag; 2004. pp. 297–310.
Publication types
MeSH terms
Substances
Grants and funding
LinkOut - more resources
Full Text Sources
Molecular Biology Databases
