

Common household activities are associated with elevated particulate matter concentrations in bedrooms of inner-city Baltimore pre-school children
- PMID: 17927974
- PMCID: PMC2291550
- DOI: 10.1016/j.envres.2007.08.012
Common household activities are associated with elevated particulate matter concentrations in bedrooms of inner-city Baltimore pre-school children
Abstract
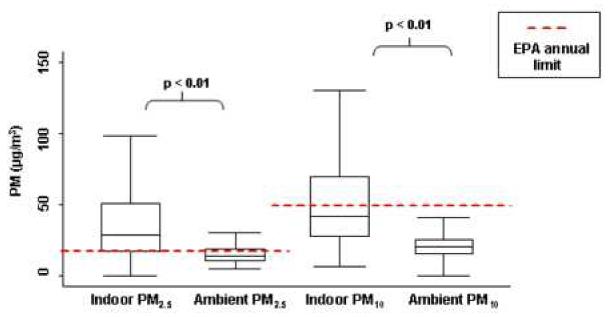
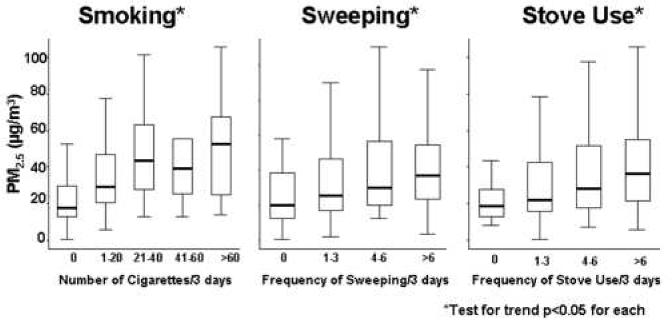
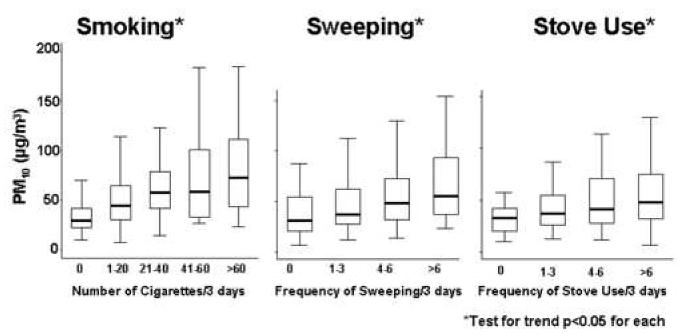
Asthma disproportionately affects inner-city, minority children in the U.S. Outdoor pollutant concentrations, including particulate matter (PM), are higher in inner-cities and contribute to childhood asthma morbidity. Although children spend the majority of time indoors, indoor PM exposures have been less extensively characterized. There is a public health imperative to characterize indoor sources of PM within this vulnerable population to enable effective intervention strategies. In the present study, we sought to identify determinants of indoor PM in homes of Baltimore inner-city pre-school children. Children ages 2-6 (n=300) who were predominantly African-American (90%) and from lower socioeconomic backgrounds were enrolled. Integrated PM(2.5) and PM(10) air sampling was conducted over a 3-day period in the children's bedrooms and at a central monitoring site while caregivers completed daily activity diaries. Homes of pre-school children in inner-city Baltimore had indoor PM concentrations that were twice as high as simultaneous outdoor concentrations. The mean indoor PM(2.5) and PM(10) concentrations were 39.5+/-34.5 and 56.2+/-44.8 microg/m(3), compared to the simultaneously measured ambient PM(2.5) and PM(10) (15.6+/-6.9 and 21.8+/-9.53 microg/m(3), respectively). Common modifiable household activities, especially smoking and sweeping, contributed significantly to higher indoor PM, as did ambient PM concentrations. Open windows were associated with significantly lower indoor PM. Further investigation of the health effects of indoor PM exposure is warranted, as are studies to evaluate the efficacy of PM reduction strategies on asthma health of inner-city children.
Figures
References
-
- ALA (American Lung Association) Lung Disease Data in Culturally Diverse Communities. 2005. [accessed 13 February 2007]. Available: www.lungusa.org.
-
- ALA (American Lung Association) Epidemiology and Statistics Unit Research and Scientific Affairs. Trends in Asthma Morbidity and Mortality. 2005. [accessed 13 February 2007]. Available: www.lungusa.org.
-
- ALA (American Lung Association) Lung Disease Data. 2006. [accessed 12 February 2007]. Available: www.lungusa.org.
-
- Breysse PN, Buckley TJ, Williams D, Beck CM, Jo S, Merriman B, et al. Indoor exposures to air pollutants and allergens in the homes of asthmatic children in inner-city Baltimore. Environmental Research. 2005;98:167–76. - PubMed
-
- CDC. (Center for Disease Control) National Center for Health Statistics - FASTATS. 2006. [accessed 19 January 19]. Available: www.cdc.gov.
Publication types
MeSH terms
Substances
Grants and funding
LinkOut - more resources
Full Text Sources
Medical
