

SOD2 protects neurons from injury in cell culture and animal models of diabetic neuropathy
- PMID: 17927981
- PMCID: PMC2190625
- DOI: 10.1016/j.expneurol.2007.07.017
SOD2 protects neurons from injury in cell culture and animal models of diabetic neuropathy
Abstract
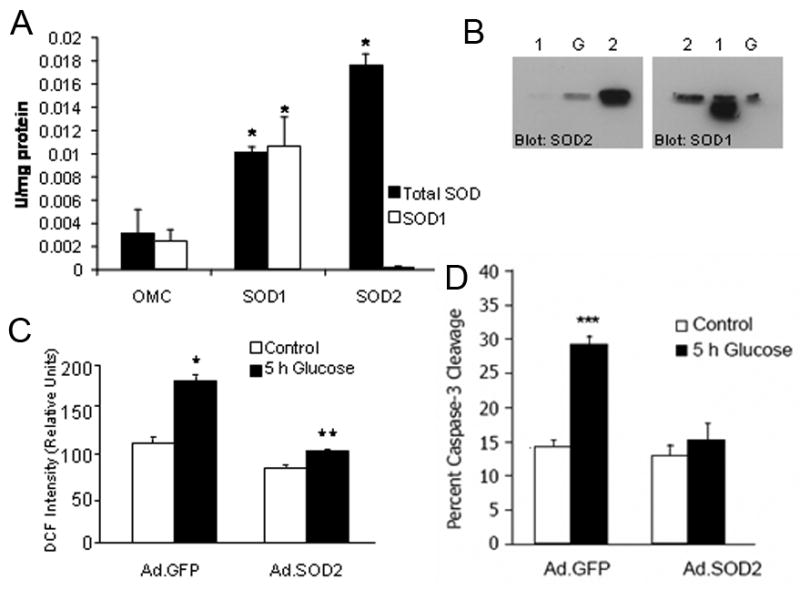
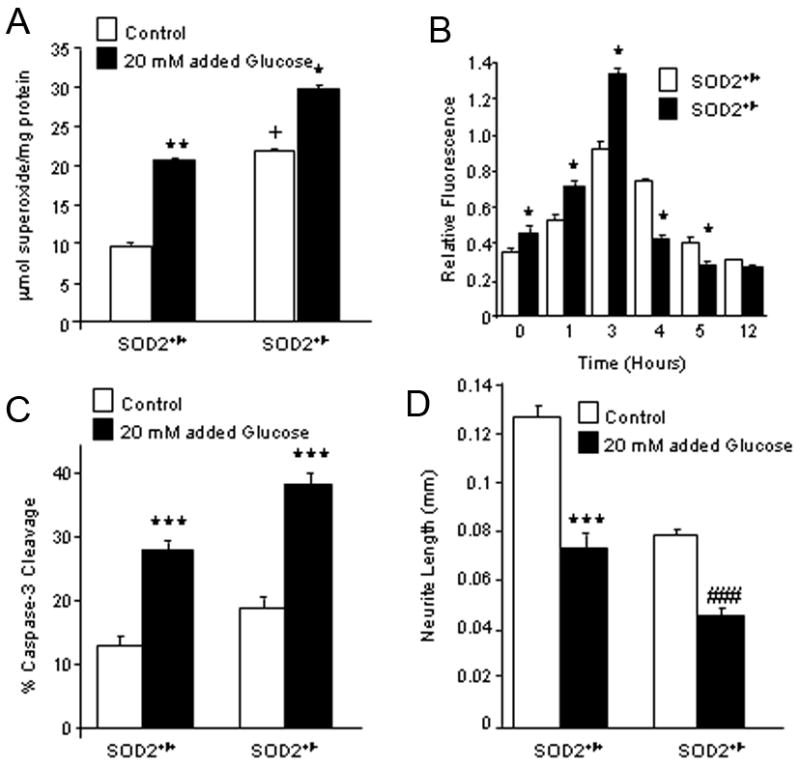
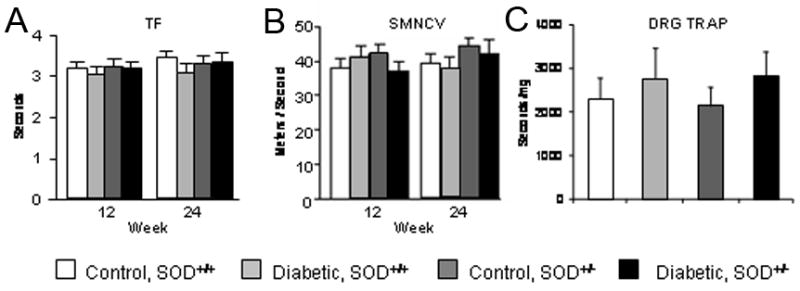
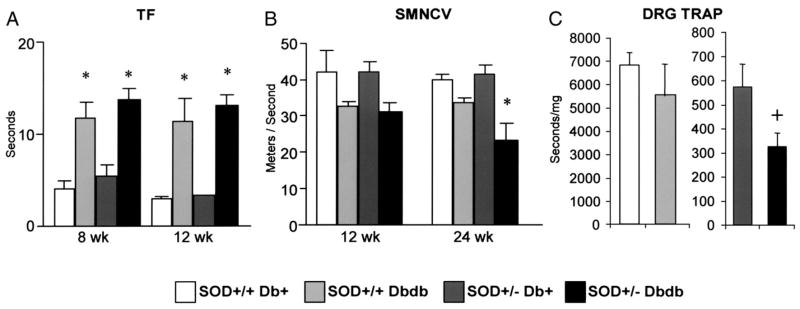
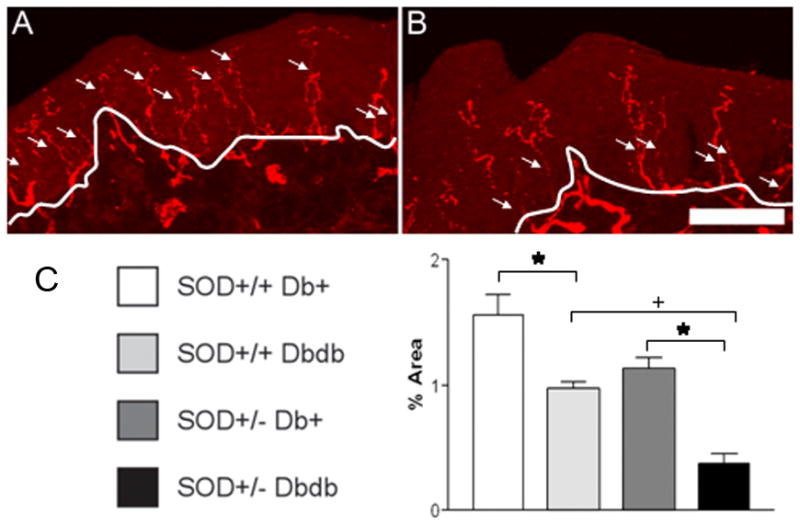
Hyperglycemia-induced oxidative stress is an inciting event in the development of diabetic complications including diabetic neuropathy. Our observations of significant oxidative stress and morphological abnormalities in mitochondria led us to examine manganese superoxide dismutase (SOD2), the enzyme responsible for mitochondrial detoxification of oxygen radicals. We demonstrate that overexpression of SOD2 decreases superoxide (O(2)(-)) in cultured primary dorsal root ganglion (DRG) neurons and subsequently blocks caspase-3 activation and cellular injury. Underexpression of SOD2 in dissociated DRG cultures from adult SOD2(+/-) mice results in increased levels of O2-, activation of caspase-3 cleavage and decreased neurite outgrowth under basal conditions that are exacerbated by hyperglycemia. These profound changes in sensory neurons led us to explore the effects of decreased SOD2 on the development of diabetic neuropathy (DN) in mice. DN was assessed in SOD2(+/-) C57BL/6J mice and their SOD2(+/+) littermates following streptozotocin (STZ) treatment. These animals, while hyperglycemic, do not display any signs of DN. DN was observed in the C57BL/6Jdb/db mouse, and decreased expression of SOD2 in these animals increased DN. Our data suggest that SOD2 activity is an important cellular modifier of neuronal oxidative defense against hyperglycemic injury.
Figures
Similar articles
-
Normalization of NF-κB activity in dorsal root ganglia neurons cultured from diabetic rats reverses neuropathy-linked markers of cellular pathology.Exp Neurol. 2013 Mar;241:169-78. doi: 10.1016/j.expneurol.2012.11.009. Epub 2012 Nov 15. Exp Neurol. 2013. PMID: 23159890
-
The TRPV1 receptor is associated with preferential stress in large dorsal root ganglion neurons in early diabetic sensory neuropathy.J Neurochem. 2008 May;105(4):1212-22. doi: 10.1111/j.1471-4159.2008.05220.x. Epub 2008 Jan 7. J Neurochem. 2008. PMID: 18182051
-
Pyruvate Dehydrogenase Kinase-mediated Glycolytic Metabolic Shift in the Dorsal Root Ganglion Drives Painful Diabetic Neuropathy.J Biol Chem. 2016 Mar 11;291(11):6011-6025. doi: 10.1074/jbc.M115.699215. Epub 2016 Jan 14. J Biol Chem. 2016. PMID: 26769971 Free PMC article.
-
PGC-1α regulation of mitochondrial degeneration in experimental diabetic neuropathy.Neurobiol Dis. 2014 Apr;64:118-30. doi: 10.1016/j.nbd.2014.01.001. Epub 2014 Jan 11. Neurobiol Dis. 2014. PMID: 24423644 Free PMC article.
-
Cultured adult animal neurons and schwann cells give us new insights into diabetic neuropathy.Curr Diabetes Rev. 2006 May;2(2):169-83. doi: 10.2174/157339906776818613. Curr Diabetes Rev. 2006. PMID: 18220625 Review.
Cited by
-
Genome-wide profiling of DNA methylation and gene expression identifies candidate genes for human diabetic neuropathy.Clin Epigenetics. 2020 Aug 12;12(1):123. doi: 10.1186/s13148-020-00913-6. Clin Epigenetics. 2020. PMID: 32787975 Free PMC article.
-
Dyslipidemia impairs mitochondrial trafficking and function in sensory neurons.FASEB J. 2018 Jan;32(1):195-207. doi: 10.1096/fj.201700206R. Epub 2017 Sep 13. FASEB J. 2018. PMID: 28904018 Free PMC article.
-
Dimethyl fumarate improves nuclear factor erythroid-related factor 2-mediated antioxidant response to ameliorate functional and molecular deficits in experimental diabetic neuropathy.Indian J Pharmacol. 2024 Nov 1;56(6):386-395. doi: 10.4103/ijp.ijp_540_24. Epub 2025 Feb 19. Indian J Pharmacol. 2024. PMID: 39973827 Free PMC article.
-
Hyperglycemia-induced tau cleavage in vitro and in vivo: a possible link between diabetes and Alzheimer's disease.J Alzheimers Dis. 2013;34(3):727-39. doi: 10.3233/JAD-121669. J Alzheimers Dis. 2013. PMID: 23254634 Free PMC article.
-
A simple, step-by-step dissection protocol for the rapid isolation of mouse dorsal root ganglia.BMC Res Notes. 2016 Feb 11;9:82. doi: 10.1186/s13104-016-1915-8. BMC Res Notes. 2016. PMID: 26864470 Free PMC article.
References
-
- Alho H, Leinonen JS, Erhola M, Lonnrot K, Aejmelaeus R. Assay of Antioxidant Capacity of Human Plasma and CSF in Aging and Disease. Restor Neurol Neurosci. 1998;12:159–165. - PubMed
-
- Ali SS, Hardt JI, Quick KL, Kim-Han JS, Erlanger BF, Huang TT, Epstein CJ, Dugan LL. A biologically effective fullerene (C60) derivative with superoxide dismutase mimetic properties. Free Radic Biol Med. 2004;37:1191–1202. - PubMed
-
- Arezzo JC. New developments in the diagnosis of diabetic neuropathy. Am J Med. 1999;107:9S–16S. - PubMed
-
- Bolanos JP, Cidad P, Garcia-Nogales P, gado-Esteban M, Fernandez E, Almeida A. Regulation of glucose metabolism by nitrosative stress in neural cells. Mol Aspects Med. 2004;25:61–73. - PubMed
-
- Breyer MD, Bottinger E, Brosius FC, III, Coffman TM, Harris RC, Heilig CW, Sharma K. Mouse models of diabetic nephropathy. J Am Soc Nephrol. 2005;16:27–45. - PubMed
Publication types
MeSH terms
Substances
Grants and funding
LinkOut - more resources
Full Text Sources
Other Literature Sources
Medical
Research Materials
Miscellaneous
