. 2008 Jan;82(1):300-10.
doi: 10.1128/JVI.01794-07. Epub 2007 Oct 10.

Type I interferons are essential in controlling neurotropic coronavirus infection irrespective of functional CD8 T cells

Affiliations

Type I interferons are essential in controlling neurotropic coronavirus infection irrespective of functional CD8 T cells

Derek D C Ireland et al. J Virol. 2008 Jan.

Abstract

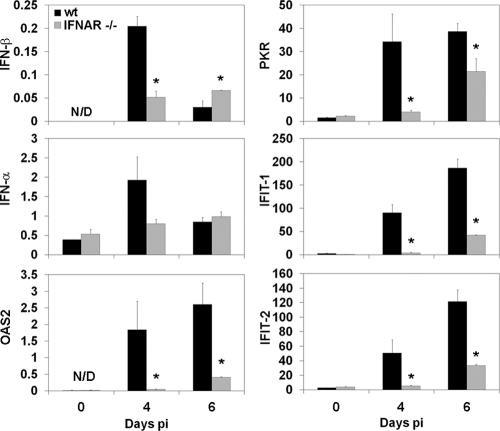
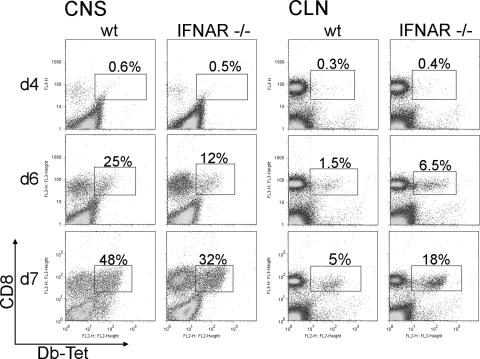
Neurotropic coronavirus infection induces expression of both beta interferon (IFN-beta) RNA and protein in the infected rodent central nervous system (CNS). However, the relative contributions of type I IFN (IFN-I) to direct, cell-type-specific virus control or CD8 T-cell-mediated effectors in the CNS are unclear. IFN-I receptor-deficient (IFNAR(-/-)) mice infected with a sublethal and demyelinating neurotropic virus variant and those infected with a nonpathogenic neurotropic virus variant both succumbed to infection within 9 days. Compared to wild-type (wt) mice, replication was prominently increased in all glial cell types and spread to neurons, demonstrating expanded cell tropism. Furthermore, increased pathogenesis was associated with significantly enhanced accumulation of neutrophils, tumor necrosis factor alpha, interleukin-6, chemokine (C-C motif) ligand 2, and IFN-gamma within the CNS. The absence of IFN-I signaling did not impair induction or recruitment of virus-specific CD8 T cells, the primary adaptive mediators of virus clearance in wt mice. Despite similar IFN-gamma-mediated major histocompatibility complex class II upregulation on microglia in infected IFNAR(-/-) mice, class I expression was reduced compared to that on microglia in wt mice, suggesting a synergistic role of IFN-I and IFN-gamma in optimizing class I antigen presentation. These data demonstrate a critical direct antiviral role of IFN-I in controlling virus dissemination within the CNS, even in the presence of potent cellular immune responses. By limiting early viral replication and tropism, IFN-I controls the balance of viral replication and immune control in favor of CD8 T-cell-mediated protective functions.


Figures

FIG. 1.
FIG. 1.
IFN-I signaling is required for protection from glia-tropic MHV-JHM infection. (A) Survival rates of wt and IFNAR−/− mice (n = 15/group) after infection with MHV-JHM. (B) Virus replication (PFU/brain) in the brain following infection. Data are the means of three to six mice per time point ± standard errors of the means. Asterisks indicate statistical significance (P ≤ 0.05) in comparison to wt mice.
FIG. 2.
FIG. 2.
CNS expression of IFN-I and IFN-stimulated genes in response to infection. Brains from uninfected (0) and infected (day 4 and 6) wt and IFNAR−/− mice were analyzed for mRNA levels of IFN-β, IFN-α, and IFN-stimulated gene products OAS2, PKR, IFIT-1, and IFIT-2 by quantitative real-time PCR (n = 3 mice per time point). Data are calculated as levels relative to the housekeeping gene product glyceraldehyde-3-phosphate dehydrogenase and representative of two independent experiments. N/D, not detected. Asterisks indicate statistical significance (P ≤ 0.05) in comparison to wt mice.
FIG. 3.
FIG. 3.
Influence of IFN-I signaling on viral antigen distribution. Viral antigen detected by immunoperoxidase staining using MAb J.3.3 (red chromogen; hematoxylin counterstain) in brains from infected wt (A, C, and E) and IFNAR−/− (B, D, and F) mice at day 6 p.i. Arrows mark antigen-positive cells, and arrowheads mark perivascular inflammatory infiltrates (A and B). Note increased foci of viral antigen-positive cells in deep cerebral white matter (B and D) and in glial cells and hippocampus pyramidal neurons (arrowheads) (F) in the absence of IFN-α/β signaling. Bars, 200 μm (A and B), 50 μm (25 μm for inset) (C and D), and 100 μm (40 μm for inset) (E and F).
FIG. 4.
FIG. 4.
Neutrophils dominate cell infiltrates in the CNS of IFNAR−/− mice. Numbers and composition of brain-infiltrating cells in infected wt and IFNAR−/− mice analyzed by flow cytometry at the indicated times p.i. (A) Numbers of bone marrow-derived CD45high cells/brain. (B to E) Percentages of cell subsets within the infiltrating population identified as neutrophils (B), macrophages (C), CD4 T cells (D), and CD8 T cells (E). Data are the means of three experiments (pooled from three mice/group) per time point ± standard errors of the means. Asterisks indicate statistical significance (P ≤ 0.05) in comparison to wt mice.
FIG. 5.
FIG. 5.
Enhanced inflammatory responses in IFNAR−/− mice. CBA was used to measure the concentrations of inflammatory cytokines in brain supernatants of wt and IFNAR−/− mice. Bars indicate the mean concentrations of cytokines ± standard errors of the means. Data are derived from two independent experiments (n = 6 per time point). Asterisks indicate statistical significance (P ≤ 0.05) in comparison to wt mice.
FIG. 6.
FIG. 6.
Impaired IFN-I signaling does not affect expansion and CNS recruitment of virus-specific CD8 T cells. Cells derived from the CNS and CLN of infected mice were analyzed for the frequency of Db-S510-specific CD8 T cells by flow cytometry at the indicated days p.i. Representative density plots depict staining with anti-CD8 MAb and Db-S510 tetramer (Db-Tet) within the CD45high infiltrating cells and within CLN-derived cells, respectively. Boxed regions depict tetramer+ CD8 T cells. Percentages represent the proportions of tetramer+ cells within the CD8 T-cell population. Data shown are representative of three independent experiments.
FIG. 7.
FIG. 7.
IFN-I signaling does not regulate CD8 T-cell effector function. (A) IFN-γ levels measured by CBA in brain supernatants of infected mice. Data represent the mean IFN-γ concentrations from two combined experiments ± standard errors of the means (n = 6). Asterisks indicate statistical significance (P ≤ 0.05) in comparison to wt mice. (B and C) Cells derived from brains at day 7 p.i. incubated in the absence (−) or presence (+) of S510 or M133 peptide for 6 h to stimulate virus-specific CD8 T cells (B) or CD4 T cells (C), respectively. EL-4 or CHB3 cells were used as CD8 or CD4 T-cell stimulator cells, respectively. Flow cytometry plots demonstrate intracellular staining for IFN-γ in CD8 T cells and CD4 T cells (gated on CD45high infiltrating cells). The numbers within each plot indicate the percentages of IFN-γ-positive cells within the T-cell population. Data are representative of two independent experiments.
FIG. 8.
FIG. 8.
MHC class I but not class II expression by microglia is reduced in the absence of IFN-I signaling. Cells isolated from the CNS were analyzed for MHC class I (H-2Db) and class II (I-Ab) expression at the indicated times p.i. (A and C) Histograms revealing kinetics of class I (A) or class II (C) expression are gated on CD45low microglia (left panels) and CD45high, F4/80+ bone marrow-derived infiltrating macrophages (right panels, MΦ). MHC class I or class II expression by wt cells is indicated by gray lines, and that by IFNAR−/− cells is indicated by black lines. Isotype control MAb staining is indicated by filled histograms. Numbers in the right corner of each plot in panel A indicate the mean fluorescence intensity of H-2Db staining. Plots are representative of three independent experiments. (B and D) The proportion of microglia expressing class I (B) or class II (D) at the indicated days p.i. Data represent the means of three experiments ± standard errors of the means.

References

    1. Bahl, K., S. K. Kim, C. Calcagno, D. Ghersi, R. Puzone, F. Celada, L. K. Selin, and R. M. Welsh. 2006. IFN-induced attrition of CD8 T cells in the presence or absence of cognate antigen during the early stages of viral infections. J. Immunol. 1764284-4295. - PubMed
    1. Bailey, S. L., P. A. Carpentier, E. J. McMahon, W. S. Begolka, and S. D. Miller. 2006. Innate and adaptive immune responses of the central nervous system. Crit. Rev. Immunol. 26149-188. - PubMed
    1. Bergmann, C. C., J. D. Altman, D. Hinton, and S. A. Stohlman. 1999. Inverted immunodominance and impaired cytolytic function of CD8+ T cells during viral persistence in the central nervous system. J. Immunol. 1633379-3387. - PubMed
    1. Bergmann, C. C., T. E. Lane, and S. A. Stohlman. 2006. Coronavirus infection of the central nervous system: host-virus stand-off. Nat. Rev. Microbiol. 4121-132. - PMC - PubMed
    1. Bergmann, C. C., B. Parra, D. R. Hinton, R. Chandran, M. Morrison, and S. A. Stohlman. 2003. Perforin-mediated effector function within the central nervous system requires IFN-gamma-mediated MHC up-regulation. J. Immunol. 1703204-3213. - PubMed

Publication types

MeSH terms

LinkOut - more resources