Comparative Study
. 2007 Oct 10;27(41):10947-56.
doi: 10.1523/JNEUROSCI.2603-07.2007.

A pathway-specific function for different AMPA receptor subunits in amygdala long-term potentiation and fear conditioning

Affiliations
Comparative Study

A pathway-specific function for different AMPA receptor subunits in amygdala long-term potentiation and fear conditioning

Yann Humeau et al. J Neurosci. .

Abstract

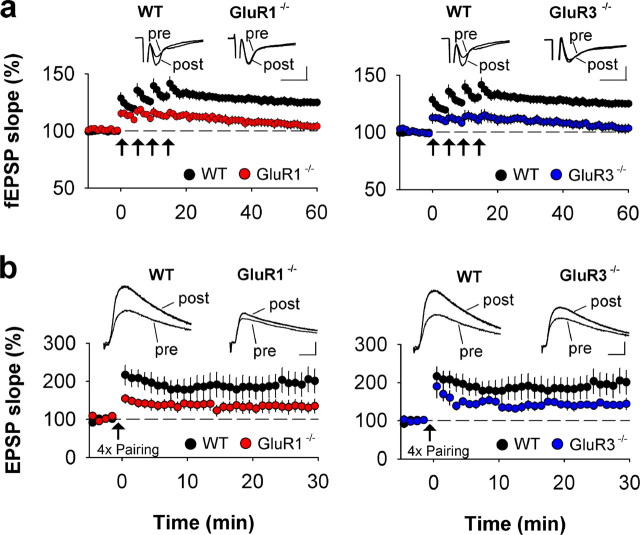
The AMPA receptor subunit glutamate receptor 1 (GluR1 or GluR-A) contributes to amygdala-dependent emotional learning. It remains unclear, however, to what extent different amygdala pathways depend on GluR1, or other AMPA receptor subunits, for proper synaptic transmission and plasticity, and whether GluR1-dependent long-term potentiation (LTP) is necessary for auditory and contextual fear conditioning. Here, we dissected the role of GluR1 and GluR3 (GluR-C) subunits in AMPA receptor-dependent amygdala LTP and fear conditioning using knock-out mice (GluR1-/- and GluR3-/-). We found that, whereas LTP at thalamic inputs to lateral amygdala (LA) projection neurons and at glutamatergic synapses in the basal amygdala was completely absent in GluR1-/- mice, both GluR1 and GluR3 contributed to LTP in the cortico-LA pathway. Because both auditory and contextual fear conditioning were selectively impaired in GluR1-/- but not GluR3-/- mice, we conclude that GluR1-dependent synaptic plasticity is the dominant form of LTP underlying the acquisition of auditory and contextual fear conditioning, and that plasticity in distinct amygdala pathways differentially contributes to aversive conditioning.


Figures

Figure 1.
Figure 1.
Reduced mEPSC amplitude and frequency in GluR1−/− and GluR3−/− mice. a, Representative sample traces from WT, GluR1−/−, and GluR3−/− mice. Calibration: 12 pA, 350 ms. b, Histograms illustrating the relative reduction in large amplitude events in GluR1−/− and GluR3−/− animals relative to wild-type controls. Histograms are normalized to the total number of events recorded in each genotype. The gray line indicates mEPSC amplitude distribution in wild-type mice. The traces represent averaged mEPSC waveforms obtained from all events. Calibration: 7 pA, 5 ms. c, Cumulative distributions of mEPSC amplitude, interevent intervals, and τdecay for all genotypes containing 300 randomly selected events from each cell (wild type, n = 20 cells; GluR1−/−, n = 14; GluR3−/−, n = 6). The insets show mean ± SEM for mEPSC amplitude, frequency, and τdecay. The traces illustrate increased decay in GluR3−/− mice (traces are peak-scaled averages obtained from all cells). Calibration, 5 ms. *p < 0.05; **p < 0.01.
Figure 2.
Figure 2.
GluR1−/− mice exhibit a decreased AMPA/NMDA ratio of evoked synaptic transmission at thalamo- and cortico-LA synapses. a, Placement of stimulation and recording electrodes. b, Sample traces depicting evoked EPSC waveforms at thalamo- and cortico-LA synapses recorded at −70 mV and at +30 mV in wild-type, GluR1−/−, and GluR3−/− mice. The AMPA component was obtained by measuring the EPSC peak amplitude at −70 mV; the NMDA component was determined by measuring the current amplitude at 100 ms after EPSC onset at +30 mV (arrows). c, Averaged data illustrating the significant (p < 0.05) reduction in the AMPA/NMDA ratio at cortical and thalamic afferents in GluR1−/− mice. Number of experiments is indicated on bars. *p < 0.05. Error bars indicate SEM.
Figure 3.
Figure 3.
GluR1−/− mice exhibit a reduction in quantal amplitude at thalamo- and cortico-LA synapses. a, Sample traces of evoked EPSCs in the presence of Ca2+ or Sr2+. In the presence of Sr2+, asynchronous quantal events are detectable. Calibration: 20 pA, 50 ms; insets, 10 pA, 25 ms. b, Normalized histograms illustrating the selective reduction in mEPSC amplitude in the two pathways in GluR1−/− mice (wild type, n = 691 events from 5 cells; GluR1−/−, n = 985 events from 5 cells; GluR3−/−, n = 713 events from 5 cells). Fits indicate mEPSC amplitude distribution in wild-type animals. c, Same data plotted as cumulative probability distributions and averaged means ± SEM (insets). d, GluR1−/− and GluR3−/− exhibited no significant difference in mEPSC kinetics (wild type, n = 5; GluR1−/−, n = 5; GluR3−/−, n = 5; p > 0.05). Superimposed traces represent amplitude-scaled mEPSC waveforms obtained by averaging the scaled mean mEPSC waveforms from each cell. Calibration, 4 ms. *p < 0.05; **p < 0.01.
Figure 4.
Figure 4.
Selective absence of thalamo-LA LTP in GluR1−/− but not GluR3−/−mice. a, Time course of the fEPSP slope at thalamic afferents in wild-type (n = 22), GluR1−/− (n = 27), and GluR3−/− (n = 17) mice. Whereas wild-type and GluR3−/− animals exhibited significant LTP (p < 0.01), LTP could not be induced in GluR1−/− animals (p = 0.77). LTP was induced by tetanic stimulation of thalamic afferents (100 Hz; 1 s; repeated 4 times with 5 min interval). The depicted traces show averaged fEPSPs before and 45 min after the last tetanization. Calibration: 0.5 mV, 5 ms. b, Pairing-induced LTP at thalamic afferents is selectively abolished in GluR1−/− but not GluR3−/− mice. Time course of the EPSP slope at thalamo-LA synapses in wild-type (n = 12), GluR1−/− (n = 9), and GluR3−/− (n = 5) mice. LTP was induced by pairing afferent stimulation (4 times; 1 s, 100 Hz; arrow) with postsynaptic depolarization to −20 mV. The depicted traces show averaged EPSPs for 2 min of baseline and 2 min of LTP (25–30 min after pairing). Calibration: 2 mV, 10 ms.
Figure 5.
Figure 5.
Equal reduction of LTP at cortico-LA synapses in GluR1−/− and GluR3−/− mice. a, Time course of the fEPSP slope in the cortico-LA pathway in wild-type (n = 34), GluR1−/− (n = 33), and GluR3−/− (n = 26) mice. LTP in both GluR1−/− and GluR3−/− animals was absent 40–45 min after induction (p > 0.05). LTP was induced by tetanic stimulation of cortical afferents (4 times; 1 s, 100 Hz). The depicted traces show averaged fEPSPs before and 45 min after the last tetanization. Calibration: 0.5 mV, 5 ms. b, Pairing-induced LTP at cortico-LA synapses is equally reduced in GluR1−/− and GluR3−/− mice. Time course of the EPSP slope in the cortico-LA pathway in wild-type (n = 14), GluR1−/− (n = 7), and GluR3−/− (n = 5) mice. LTP was induced by pairing afferent stimulation (4 times; 1 s; 100 Hz; arrow) with postsynaptic depolarization to −20 mV. The depicted traces show averaged EPSPs for 2 min of baseline and 2 min of LTP (25–30 min after pairing). Calibration: 2 mV, 10 ms.
Figure 6.
Figure 6.
Selective absence of LTP in the BA in GluR1−/− but not GluR3−/− mice. a, Placement of stimulation and recording electrodes. b, Time course of the fEPSP slope in the basal amygdala of wild-type (n = 12) and GluR1−/− (n = 16) mice. Whereas wild-type animals exhibit robust LTP (p < 0.05), LTP is completely abolished in GluR1−/− mice (p > 0.05). c, GluR3−/− animals (n = 13) exhibit normal LTP (p < 0.05). LTP was induced by tetanic stimulation of local afferents (100 Hz; 1 s; repeated 4 times with 5 min interval). The depicted traces show averaged fEPSPs before and 45 min after the last tetanization. Calibration: 0.5 mV, 2.5 ms.
Figure 7.
Figure 7.
GluR1−/− mice exhibit a complete lack of CS- and context-induced fear behavior during conditioning. a, Mean infrared activity (IR) levels during the three presentations of the 30 s auditory CS. Whereas WT (n = 13; p < 0.05) and GluR3−/− (n = 9; p < 0.05) mice exhibit a significant reduction in activity levels during conditioning, activity levels in GluR1−/− mice (n = 9) remain unaffected (p > 0.05). Number of CS is indicated on the x-axis. A two-way ANOVA revealed no main effect on genotype on baseline activity before CS–US pairing time bin; largest F(11,308) = 1.20, p > 0.20. Analysis of the activity scores during the three CS presentations revealed a main effect of genotype (F(2,28) = 6.68; p < 0.01), and CS presentation (F(2,28) = 34.96; p < 0.0001). There was a significant genotype by CS presentation interaction (F(4,56) = 7.43; p < 0.0001). Analysis of the simple main effects followed by post hoc Newman–Keuls comparisons revealed a significant effect of genotype during the second and third CS presentation (smallest F(2,56) = 3.18; p < 0.05) with GluR1−/− mice differing from GluR3−/− and wild-type groups (p < 0.05). b, Percentage of freezing responses during the three presentations of the 30 s auditory CS. Only WT (n = 13; p < 0.05) and GluR3−/− (n = 9; p < 0.05) animals show a significant increase in freezing levels. Freezing levels of GluR1−/− mice do not increase during conditioning (n = 9; p > 0.05). The number of CS is indicated on the x-axis. There is a main effect of genotype (F(2,28) = 61.30; p < 0.0001) and of CS presentation (F(2,28) = 122.87; p < 0.0001) and a significant interaction between these two factors (F(4,56) = 30.43; p < 0.0001). Simple main effects analysis followed by post hoc Newman–Keuls comparisons revealed a significant effect of genotype during the second and third CS presentations (smallest F(2,56) = 38.57; p < 0.001), with GluR1−/− mice differing from all other genotypes (p < 0.05). c, Mean IR activity levels during the ITIs. Number of ITIs preceding CS1, CS2, and CS3 are indicated on the x-axis. During the ITIs, GluR1−/− mice do not exhibit any reduction in locomotor activity with conditioning (n = 9; p > 0.05), whereas activity levels are significantly reduced in WT (n = 13; p < 0.05) and GluR3−/− (n = 9; p < 0.05) mice. A two-way mixed ANOVA of the activity data revealed a main effect of genotype (F(2,28) = 6.47; p < 0.01) and of activity time bin (F(2,56) = 59.38; p < 0.0001) and a genotype by ITI time bin interaction (F(4,56) = 22.07; p < 0.0001). d, Percentage of freezing responses during the ITIs does not increase in GluR1−/− mice (n = 9; p > 0.05), whereas WT (n = 13; p < 0.05) and GluR3−/− (n = 9; p < 0.05) mice exhibit a significant increase in freezing levels with a main effects of genotype (F(2,28) = 147.07; p < 0.0001) and of ITI time bin (F(2,56) = 219.52; p < 0.0001) and an interaction between the two factors (F(4,56) = 62.47; p < 0.0001). Simple main effects analysis followed by multiple post hoc Newman–Keuls comparisons revealed again a significant effect of genotype during the second and third ITI bins (smallest F(2,84) = 92.93; p < 0.0001), with wild-type mice differing from both knock-out groups during the second ITI bin, and GluR1−/− differing from GluR3−/− and wild-type mice during the third ITI bin (p < 0.05). Error bars indicate SD.
Figure 8.
Figure 8.
Comparable CS and US reactivity in wild-type, GluR1−/−, and GluR3−/− mice. a, Mean infrared activity (IR) levels for the 4 s period before presentation of the first CS during conditioning, and the 4 s period of CS presentation does not differ between WT, GluR1−/−, and GluR3−/− mice. Activity scores averaged across 0.5 s time bins (WT, n = 13; GluR1−/−, n = 9; GluR3−/−, n = 9; p > 0.05). A two-way ANOVA of the activity data revealed no main effect of genotype (F(2,28) = 2.52; p > 0.09). There was a main effect of phase (ITI vs CS; F(1,28) = 13.58; p < 0.01), main effect of time bin (F(1,28) = 14.16; p < 0.01), and a significant interaction between these factors (F(3,84) = 3.54; p < 0.05), but no interactions involving genotype. The test of simple main effects revealed a significant effect of time bin only during the CS period (F(3,84) = 7.83; p < 0.001) that reflected a gradual rise in locomotor activity during the CS for all genotypes, suggesting that all genotypes were able to detect the presentation of the tone. b, Comparable activity levels of wild-type, GluR1−/−, and GluR3−/− animals for the 1.25 s period after presentation of the first shock. Activity scores averaged across 0.25 s time bins (WT, n = 13; GluR1−/−, n = 9; GluR3−/−, n = 9; p > 0.05). A two-way ANOVA with genotype and time bin as factors revealed no main effect of genotype (F(2,28) = 2.36; p = 0.1121). However, there was a main effect of time bin, which reflected a reduction in locomotor activity after offset of the shock (F(4,112) = 10.01; p < 0.0001).
Figure 9.
Figure 9.
GluR1−/− but not GluR3−/− mice exhibit severe memory deficits in cued and contextual fear conditioning. Retention test. a, b, The percentage observations of a freezing response (a) and the mean IR locomotor activity responses (b) during the baseline period before the CS and during the CS presentation in WT (n = 13), GluR1−/−, and GluR3−/− mice (n = 9 each). No differences in baseline freezing (F(2,28) < 1; p > 0.10; two-way ANOVA) or activity (F(2, 28) = 1.52; p > 0.10; two-way ANOVA) levels was observed. Two-way ANOVAs were conducted on the freezing response and activity data obtained during presentation of the CS. Analysis of the freezing data revealed a main effect of genotype (F(2,28) = 33.42; p < 0.0001), of time bin (F(15,420) = 23.79; p < 0.0001), and an interaction between these two factors (F(30,420) = 6.69; p < 0.0001). Analysis of the simple main effects followed by post hoc Newman–Keuls comparisons revealed a main effect of genotype during freezing bins 13–23 (smallest F(2,205) = 3.56; p < 0.05) with GluR1−/− differing from GluR3−/− and WT groups (p values < 0.05). Analysis of the infrared activity data, similarly, revealed a main effect of genotype (F(2,28) = 6.03; p < 0.01), and of activity time bin (F(15,420) = 17.01; p <. 00001), and a genotype by activity time bin interaction (F(30,420) = 1.781; p < 0.01). Simple main effects analysis revealed a main effect of genotype during activity bins 13–19 and 21–23 (smallest F(2,66) = 4.37; p < 0.05). Post hoc Newman–Keuls comparisons revealed differences between GluR1−/− mice and the remaining groups (p < 0.005). c, d, Context extinction test: the percentage observations of a freezing response (c) and the mean IR locomotor activity responses conditioning context (d) of WT (n = 13), GluR1−/−, and GluR3−/− mice (n = 9 each). WT and GluR3−/− mice showed a steady suppression of locomotor activity. GluR1−/− mice showed considerably reduced freezing responses and higher levels of locomotor activity relative to GluR3−/− and WT mice. The analysis of the freezing response data revealed a main effect of genotype (F(2,28) = 17.57; p < 0.0001) and of time bin (F(15,420) = 4.91; p < 0.0001), and an interaction between the two factors (F(30,420) = 2.92; p < 0.001). Simple main effects analysis revealed a main effect of genotype at bins 4–6 and 8–16 (smallest F(2,154) = 4.54; p < 0.05). Post hoc Newman–Keuls comparisons identified differences between GluR1−/− mice and all other groups (p values < 0.05). A two-way ANOVA analysis of the activity data revealed a main effect of genotype (F(2,28) = 6.65; p < 0.01), of activity time bin (F(15,420) = 2.21; p < 0.01), and a genotype by activity time bin interaction (F(30,420) = 3.004; p < 0.0001). Analysis of the simple main effects followed by post hoc Newman–Keuls comparisons revealed a main effect of genotype at bins 4–6 and 8–16 (smallest F(2,59) = 3.43; p < 0.05), with GluR1−/− mice differing from all other groups (p values < 0.05).

Similar articles

Cited by

References

    1. Anglada-Figueroa D, Quirk GJ. Lesions of the basal amygdala block expression of conditioned fear but not extinction. J Neurosci. 2005;25:9680–9685. - PMC - PubMed
    1. Apergis-Schoute AM, Debiec J, Doyère V, LeDoux JE, Schafe GE. Auditory fear conditioning and long-term potentiation in the lateral amygdala require ERK/MAP kinase signaling in the auditory thalamus: a role for presynaptic plasticity in the fear system. J Neurosci. 2005;25:5730–5739. - PMC - PubMed
    1. Armony JL, Servan-Schreiber D, Romanski LM, Cohen JD, LeDoux JE. Stimulus generalization of fear responses: effects of auditory cortex lesions in a computational model and in rats. Cereb Cortex. 1997;7:157–165. - PubMed
    1. Bissière S, Humeau Y, Lüthi A. Dopamine gates LTP induction in lateral amygdala by suppressing feedforward inhibition. Nat Neurosci. 2003;6:587–592. - PubMed
    1. Blanchard RJ, Blanchard DC. Passive and active reactions to fear-eliciting stimuli. J Comp Physiol Psychol. 1969;68:129–135. - PubMed

Publication types

LinkOut - more resources