

Reduced sodium current in Purkinje neurons from Nav1.1 mutant mice: implications for ataxia in severe myoclonic epilepsy in infancy
- PMID: 17928448
- PMCID: PMC6672849
- DOI: 10.1523/JNEUROSCI.2162-07.2007
Reduced sodium current in Purkinje neurons from Nav1.1 mutant mice: implications for ataxia in severe myoclonic epilepsy in infancy
Abstract
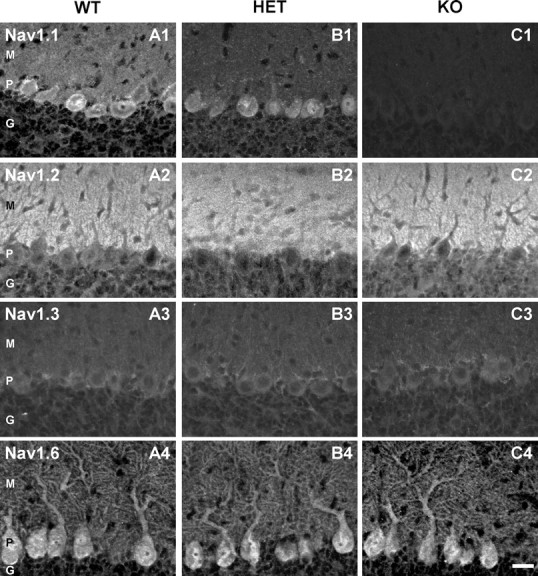
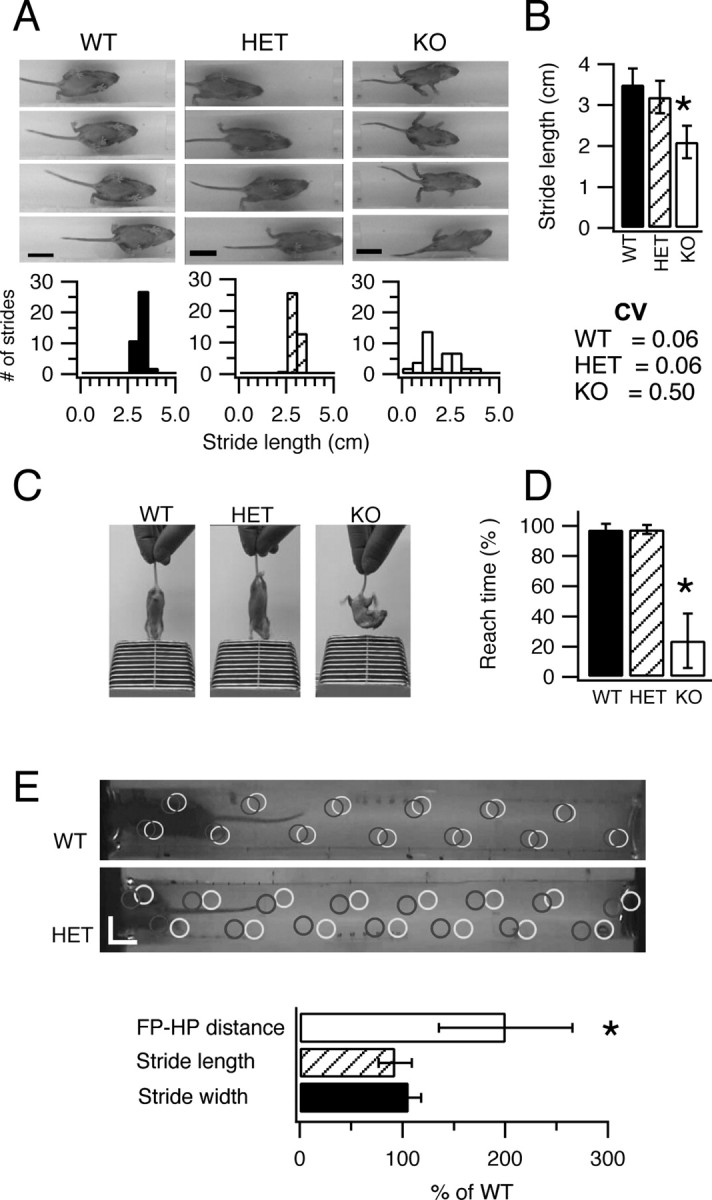
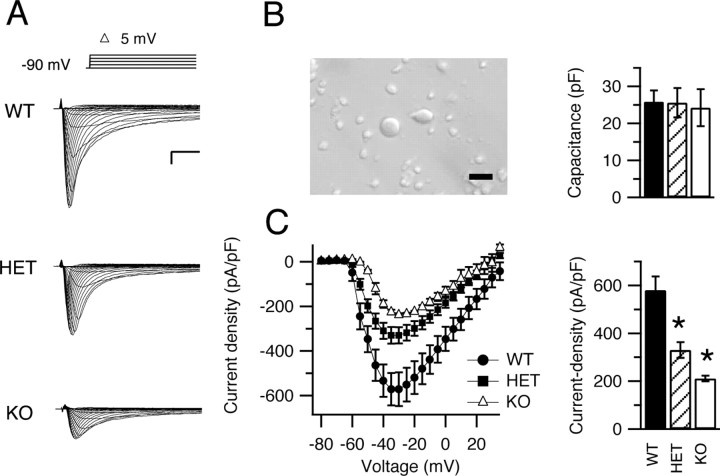
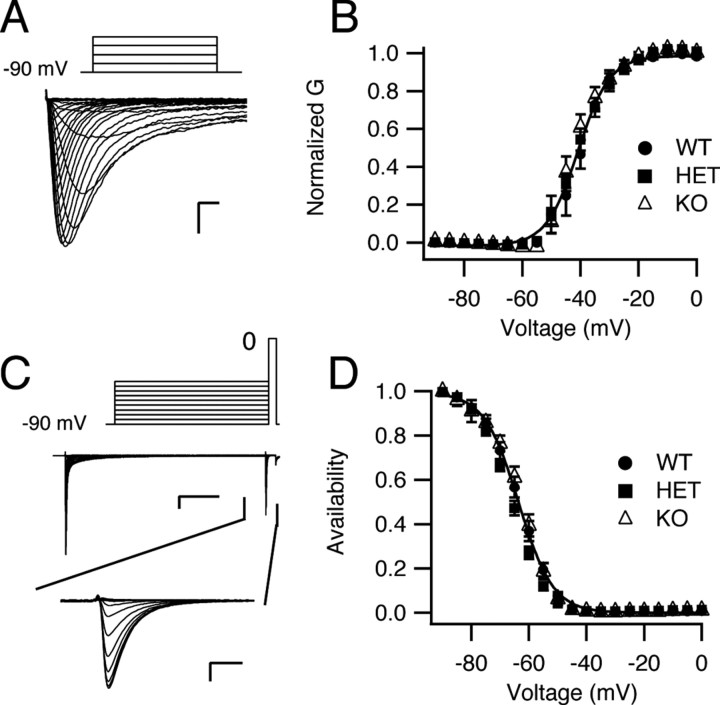
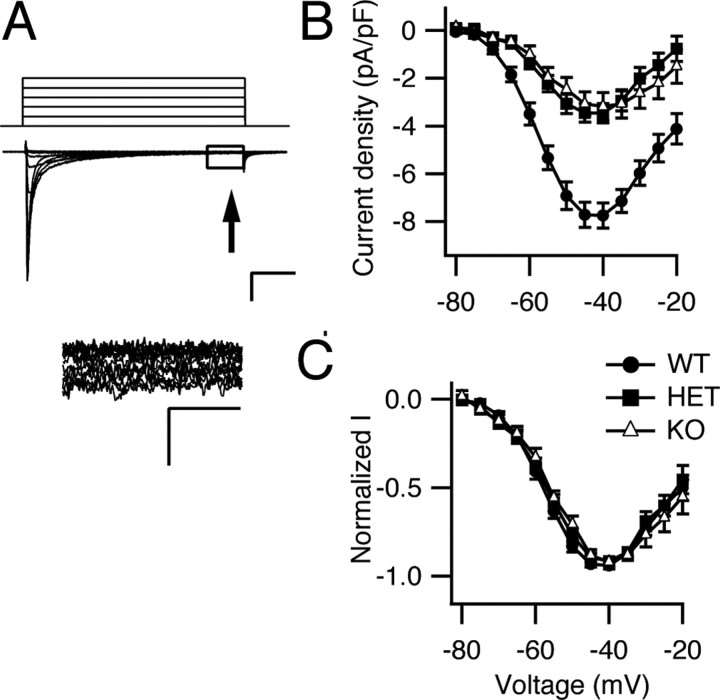
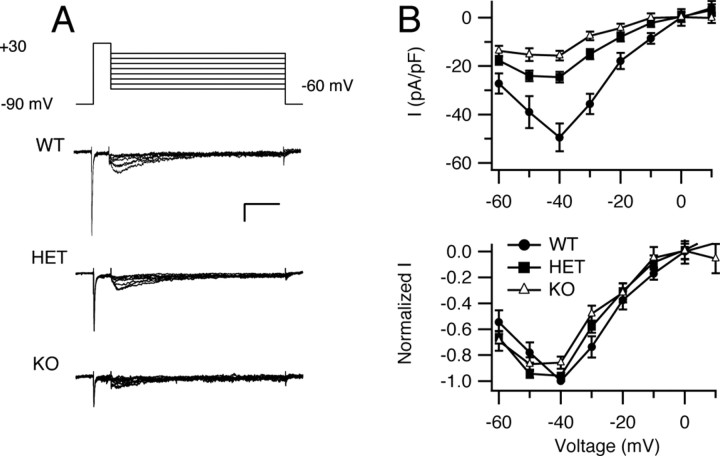
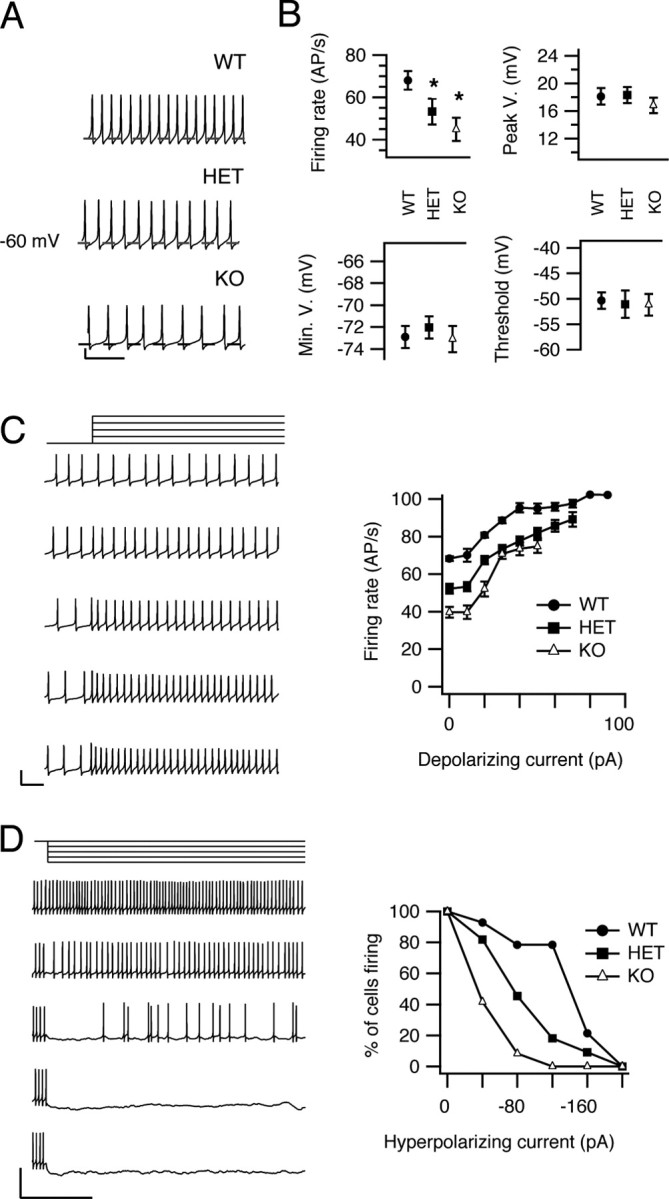
Loss-of-function mutations of Na(V)1.1 channels cause severe myoclonic epilepsy in infancy (SMEI), which is accompanied by severe ataxia that contributes substantially to functional impairment and premature deaths. Mutant mice lacking Na(V)1.1 channels provide a genetic model for SMEI, exhibiting severe seizures and premature death on postnatal day 15. Behavioral assessment indicated severe motor deficits in mutant mice, including irregularity of stride length during locomotion, impaired motor reflexes in grasping, and mild tremor in limbs when immobile, consistent with cerebellar dysfunction. Immunohistochemical studies showed that Na(V)1.1 and Na(V)1.6 channels are the primary sodium channel isoforms expressed in cerebellar Purkinje neurons. The amplitudes of whole-cell peak, persistent, and resurgent sodium currents in Purkinje neurons were reduced by 58-69%, without detectable changes in the kinetics or voltage dependence of channel activation or inactivation. Nonlinear loss of sodium current in Purkinje neurons from heterozygous and homozygous mutant animals suggested partial compensatory upregulation of Na(V)1.6 channel activity. Current-clamp recordings revealed that the firing rates of Purkinje neurons from mutant mice were substantially reduced, with no effect on threshold for action potential generation. Our results show that Na(V)1.1 channels play a crucial role in the excitability of cerebellar Purkinje neurons, with major contributions to peak, persistent, and resurgent forms of sodium current and to sustained action potential firing. Loss of these channels in Purkinje neurons of mutant mice and SMEI patients may be sufficient to cause their ataxia and related functional deficits.
Figures
Similar articles
-
NaV1.1 channels and epilepsy.J Physiol. 2010 Jun 1;588(Pt 11):1849-59. doi: 10.1113/jphysiol.2010.187484. Epub 2010 Mar 1. J Physiol. 2010. PMID: 20194124 Free PMC article. Review.
-
The contribution of resurgent sodium current to high-frequency firing in Purkinje neurons: an experimental and modeling study.J Neurosci. 2003 Jun 15;23(12):4899-912. doi: 10.1523/JNEUROSCI.23-12-04899.2003. J Neurosci. 2003. PMID: 12832512 Free PMC article.
-
Insights into pathophysiology and therapy from a mouse model of Dravet syndrome.Epilepsia. 2011 Apr;52 Suppl 2(Suppl 2):59-61. doi: 10.1111/j.1528-1167.2011.03004.x. Epilepsia. 2011. PMID: 21463282 Free PMC article. Review.
-
Impaired motor function in mice with cell-specific knockout of sodium channel Scn8a (NaV1.6) in cerebellar purkinje neurons and granule cells.J Neurophysiol. 2006 Aug;96(2):785-93. doi: 10.1152/jn.01193.2005. Epub 2006 May 10. J Neurophysiol. 2006. PMID: 16687615
-
Reduced sodium current in GABAergic interneurons in a mouse model of severe myoclonic epilepsy in infancy.Nat Neurosci. 2006 Sep;9(9):1142-9. doi: 10.1038/nn1754. Epub 2006 Aug 20. Nat Neurosci. 2006. PMID: 16921370
Cited by
-
Anticancer drug oxaliplatin induces acute cooling-aggravated neuropathy via sodium channel subtype Na(V)1.6-resurgent and persistent current.Proc Natl Acad Sci U S A. 2012 Apr 24;109(17):6704-9. doi: 10.1073/pnas.1118058109. Epub 2012 Apr 9. Proc Natl Acad Sci U S A. 2012. PMID: 22493249 Free PMC article.
-
Resurgent-like currents in mouse vas deferens myocytes are mediated by NaV1.6 voltage-gated sodium channels.Pflugers Arch. 2012 Nov;464(5):493-502. doi: 10.1007/s00424-012-1153-4. Epub 2012 Sep 18. Pflugers Arch. 2012. PMID: 22986623
-
Sodium channelopathies of skeletal muscle and brain.Physiol Rev. 2021 Oct 1;101(4):1633-1689. doi: 10.1152/physrev.00025.2020. Epub 2021 Mar 26. Physiol Rev. 2021. PMID: 33769100 Free PMC article. Review.
-
NaV1.1 haploinsufficiency impairs glutamatergic and GABAergic neuron function in the thalamus.Neurobiol Dis. 2022 Jun 1;167:105672. doi: 10.1016/j.nbd.2022.105672. Epub 2022 Feb 24. Neurobiol Dis. 2022. PMID: 35219855 Free PMC article.
-
NaV1.1 channels and epilepsy.J Physiol. 2010 Jun 1;588(Pt 11):1849-59. doi: 10.1113/jphysiol.2010.187484. Epub 2010 Mar 1. J Physiol. 2010. PMID: 20194124 Free PMC article. Review.
References
-
- Afshari FS, Ptak K, Khaliq ZM, Grieco TM, Slater NT, McCrimmon DR, Raman IM. Resurgent Na currents in four classes of neurons of the cerebellum. J Neurophysiol. 2004;92:2831–2843. - PubMed
-
- Callaway JC, Ross WN. Spatial distribution of synaptically activated sodium concentration changes in cerebellar Purkinje neurons. J Neurophysiol. 1997;77:145–152. - PubMed
-
- Cantrell AR, Ma JY, Scheuer T, Catterall WA. Muscarinic modulation of sodium current by activation of protein kinase C in rat hippocampal neurons. Neuron. 1996;16:1019–1025. - PubMed
-
- Catterall WA. From ionic currents to molecular mechanisms: the structure and function of voltage-gated sodium channels. Neuron. 2000;26:13–25. - PubMed
Publication types
MeSH terms
Substances
Grants and funding
LinkOut - more resources
Full Text Sources
Other Literature Sources
Molecular Biology Databases