

Posteromedial parietal cortical activity and inputs predict tactile spatial acuity
- PMID: 17928451
- PMCID: PMC6672842
- DOI: 10.1523/JNEUROSCI.1808-07.2007
Posteromedial parietal cortical activity and inputs predict tactile spatial acuity
Abstract
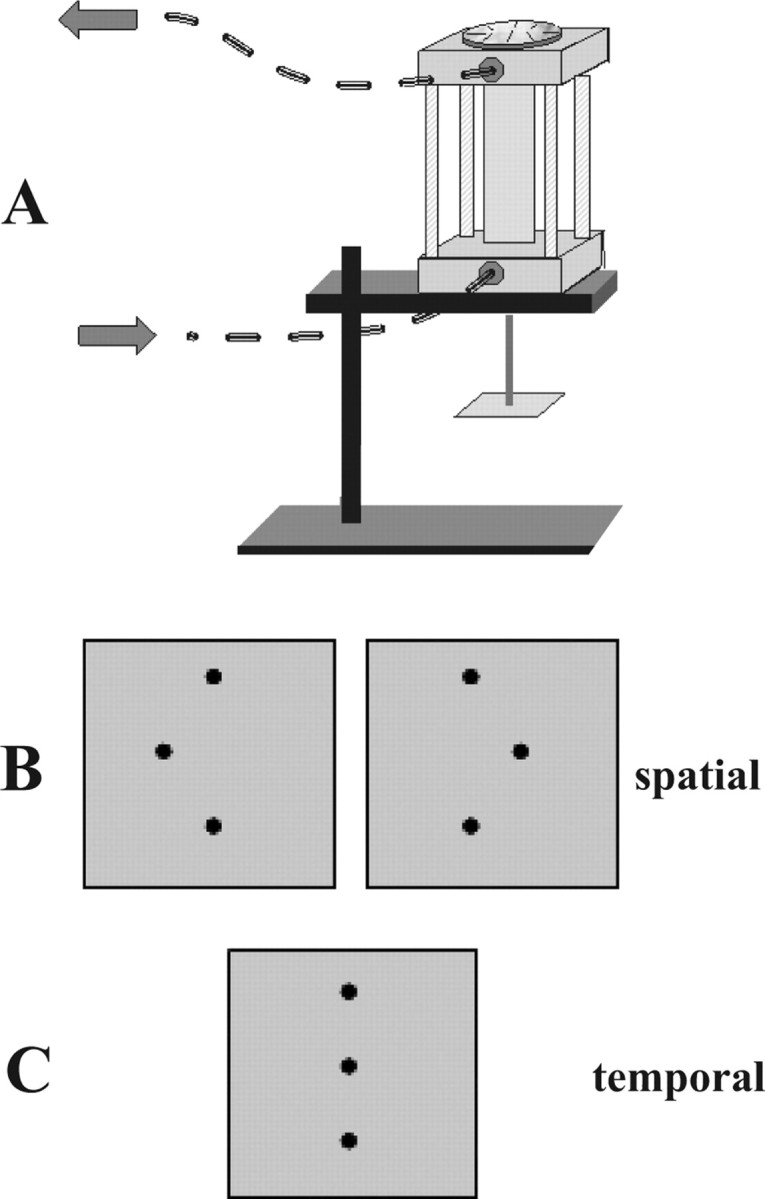
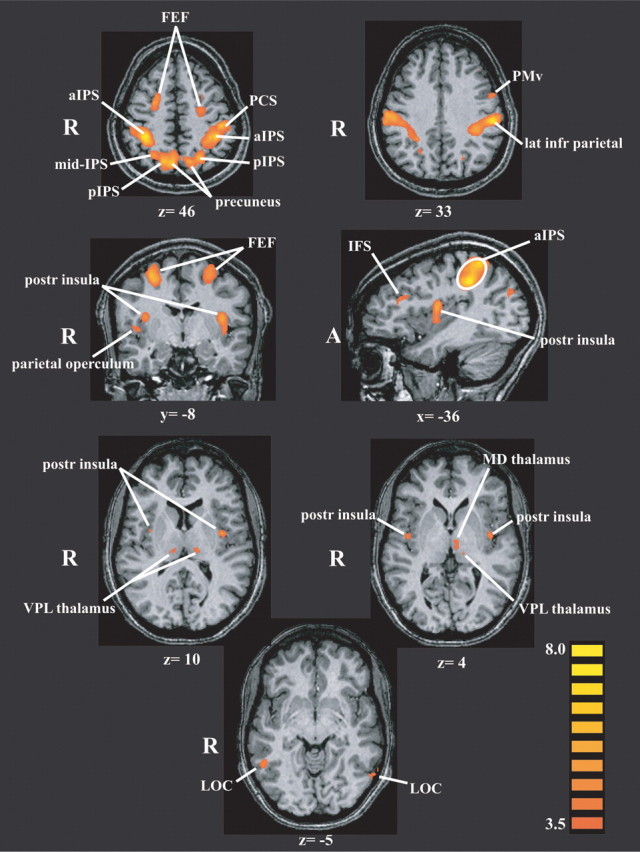
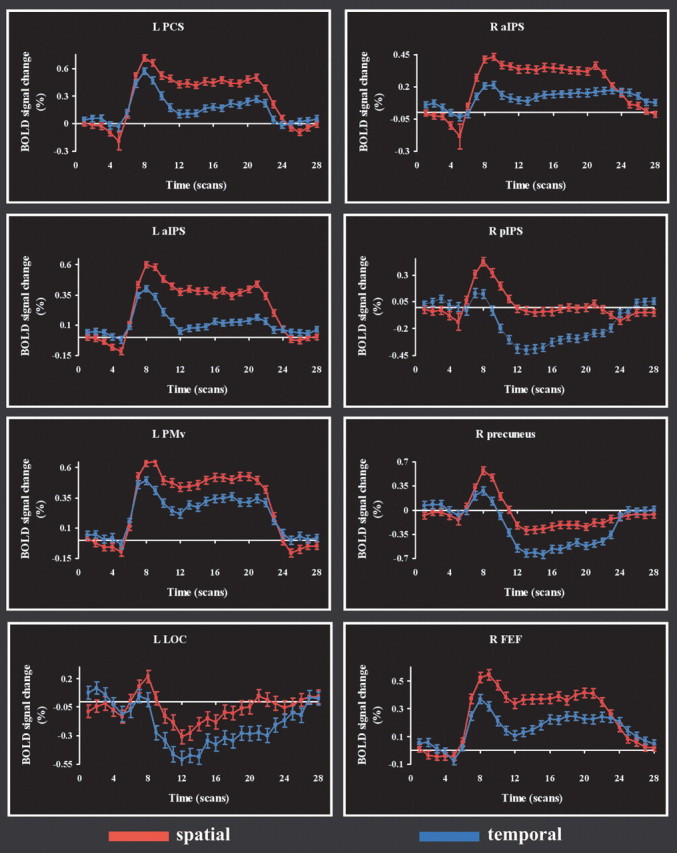
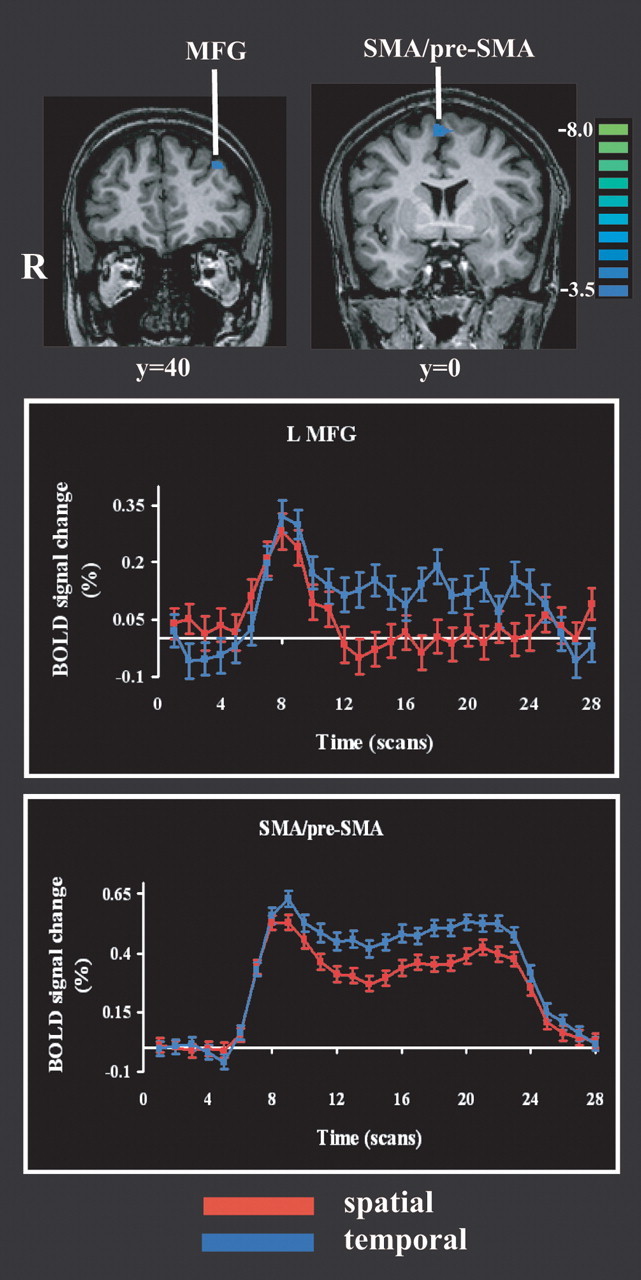
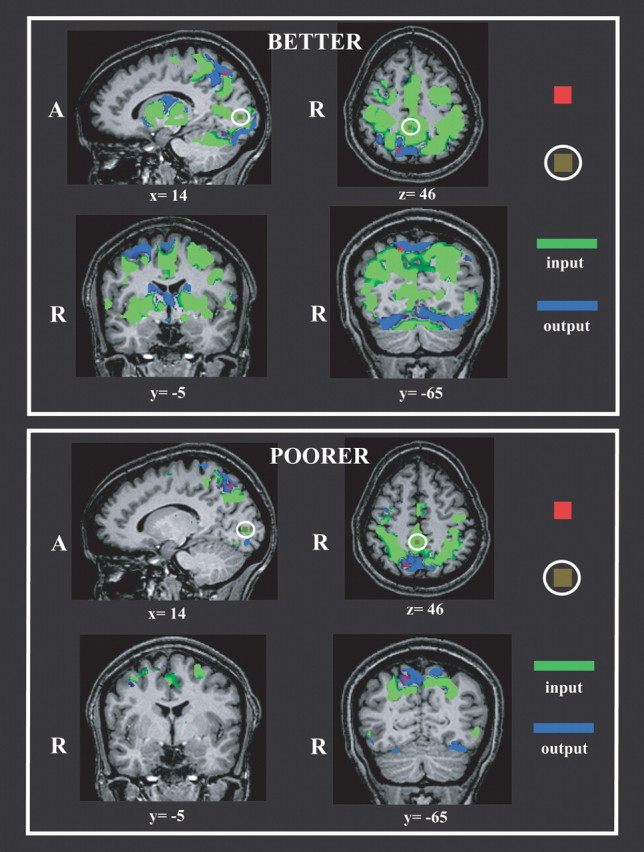
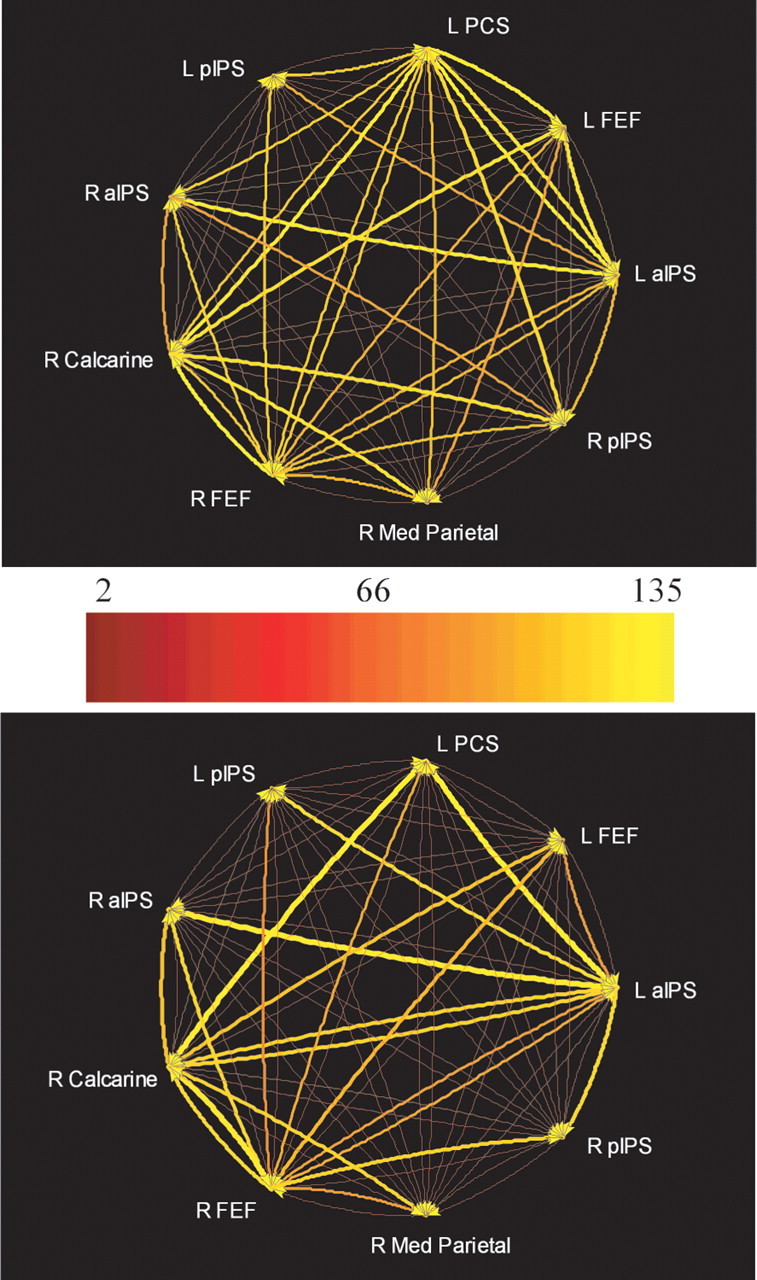
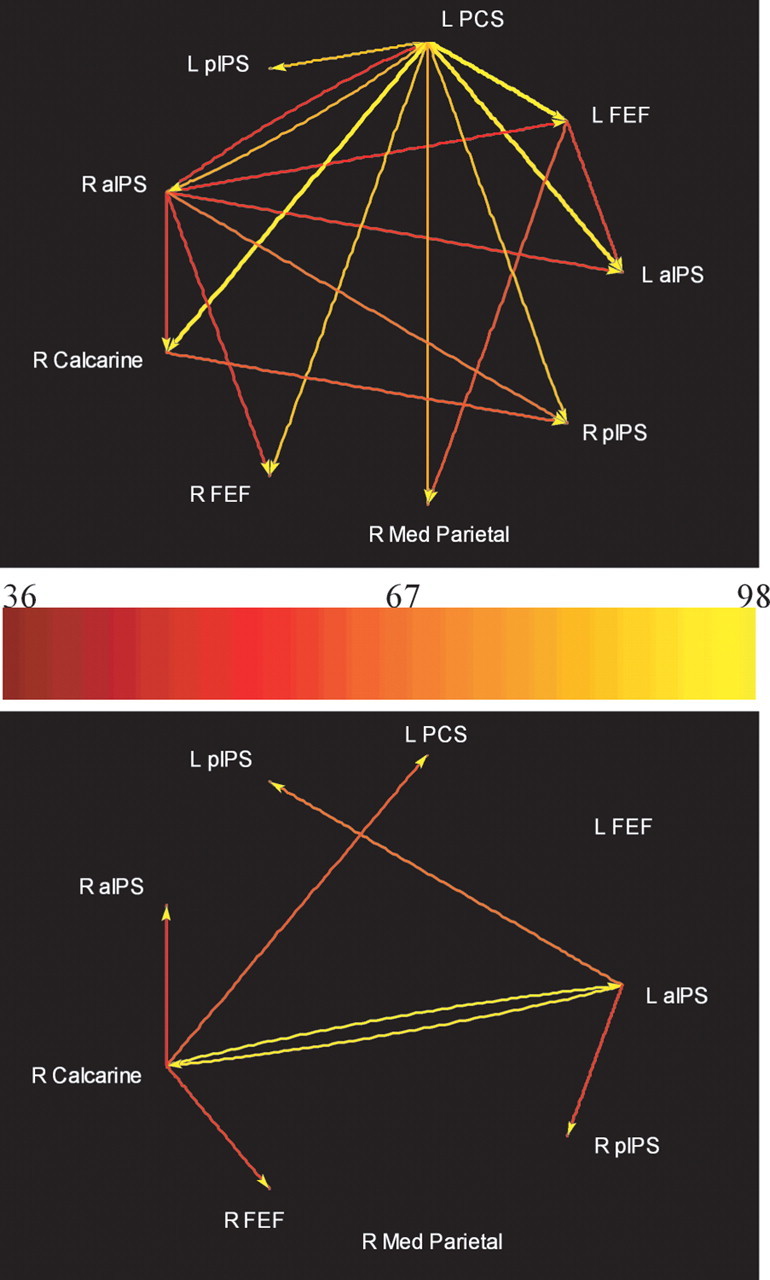
We used functional magnetic resonance imaging (fMRI) to investigate the neural circuitry underlying tactile spatial acuity at the human finger pad. Stimuli were linear, three-dot arrays, applied to the immobilized right index finger pad using a computer-controlled, MRI-compatible, pneumatic stimulator. Activity specific for spatial processing was isolated by contrasting discrimination of left-right offsets of the central dot in the array with discrimination of the duration of stimulation by an array without a spatial offset. This contrast revealed activity in a distributed frontoparietal cortical network, within which the levels of activity in right posteromedial parietal cortical foci [right posterior intraparietal sulcus (pIPS) and right precuneus] significantly predicted individual acuity thresholds. Connectivity patterns were assessed using both bivariate analysis of Granger causality with the right pIPS as a reference region and multivariate analysis of Granger causality for a selected set of regions. The strength of inputs into the right pIPS was significantly greater in subjects with better acuity than those with poorer acuity. In the better group, the paths predicting acuity converged from the left postcentral sulcus and right frontal eye field onto the right pIPS and were selective for the spatial task, and their weights predicted the level of right pIPS activity. We propose that the optimal strategy for fine tactile spatial discrimination involves interaction in the pIPS of a top-down control signal, possibly attentional, with somatosensory cortical inputs, reflecting either visualization of the spatial configurations of tactile stimuli or engagement of modality-independent circuits specialized for fine spatial processing.
Figures
Similar articles
-
Oscillatory activity in neocortical networks during tactile discrimination near the limit of spatial acuity.Neuroimage. 2014 May 1;91:300-10. doi: 10.1016/j.neuroimage.2014.01.007. Epub 2014 Jan 13. Neuroimage. 2014. PMID: 24434679 Free PMC article.
-
Effective connectivity during haptic perception: a study using Granger causality analysis of functional magnetic resonance imaging data.Neuroimage. 2008 May 1;40(4):1807-14. doi: 10.1016/j.neuroimage.2008.01.044. Epub 2008 Feb 9. Neuroimage. 2008. PMID: 18329290 Free PMC article.
-
Tactile discrimination of grating orientation: fMRI activation patterns.Hum Brain Mapp. 2005 Aug;25(4):370-7. doi: 10.1002/hbm.20107. Hum Brain Mapp. 2005. PMID: 15852384 Free PMC article.
-
Neural processing underlying tactile microspatial discrimination in the blind: a functional magnetic resonance imaging study.J Vis. 2008 Dec 17;8(10):13.1-19. doi: 10.1167/8.10.13. J Vis. 2008. PMID: 19146355 Free PMC article.
-
Time-dependent activation of parieto-frontal networks for directing attention to tactile space. A study with paired transcranial magnetic stimulation pulses in right-brain-damaged patients with extinction.Brain. 2000 Sep;123 ( Pt 9):1939-47. doi: 10.1093/brain/123.9.1939. Brain. 2000. PMID: 10960057
Cited by
-
Anticipating conflict: Neural correlates of a Bayesian belief and its motor consequence.Neuroimage. 2015 Oct 1;119:286-95. doi: 10.1016/j.neuroimage.2015.06.032. Epub 2015 Jun 18. Neuroimage. 2015. PMID: 26095091 Free PMC article.
-
Neural changes with tactile learning reflect decision-level reweighting of perceptual readout.J Neurosci. 2013 Mar 20;33(12):5387-98. doi: 10.1523/JNEUROSCI.3482-12.2013. J Neurosci. 2013. PMID: 23516304 Free PMC article.
-
Analysis of haptic information in the cerebral cortex.J Neurophysiol. 2016 Oct 1;116(4):1795-1806. doi: 10.1152/jn.00546.2015. Epub 2016 Jul 20. J Neurophysiol. 2016. PMID: 27440247 Free PMC article. Review.
-
Musical training induces functional plasticity in perceptual and motor networks: insights from resting-state FMRI.PLoS One. 2012;7(5):e36568. doi: 10.1371/journal.pone.0036568. Epub 2012 May 7. PLoS One. 2012. PMID: 22586478 Free PMC article.
-
Brain networks shaping religious belief.Brain Connect. 2014 Feb;4(1):70-9. doi: 10.1089/brain.2013.0172. Epub 2014 Jan 15. Brain Connect. 2014. PMID: 24279687 Free PMC article.
References
-
- Abler B, Roebroeck A, Goebel R, Hose A, Schoenfeldt-Lecuona C, Hole G, Walter H. Investigating directed influences between activated brain areas in a motor-response task using fMRI. Magn Reson Imaging. 2006;24:181–185. - PubMed
-
- Akaike H. A new look at the statistical model identification. IEEE Trans Autom Control. 1974;19:716–723.
-
- Blinowska KJ, Kus R, Kaminski M. Granger causality and information flow in multivariate processes. Phys Rev E. 2004;70:50902–50906. - PubMed
-
- Büchel C, Friston K. Extracting brain connectivity. In: Jezzard P, Matthews PM, Smith SM, editors. Functional MRI. An introduction to methods. Oxford: Oxford UP; 2001. pp. 295–308.
-
- Corbetta M, Shulman GL. Control of goal-directed and stimulus-driven attention in the brain. Nat Rev Neurosci. 2002;3:201–215. - PubMed
Publication types
MeSH terms
Grants and funding
LinkOut - more resources
Full Text Sources