

Hepatic gene expression during treatment with peginterferon and ribavirin: Identifying molecular pathways for treatment response
- PMID: 17929300
- PMCID: PMC2808168
- DOI: 10.1002/hep.21853
Hepatic gene expression during treatment with peginterferon and ribavirin: Identifying molecular pathways for treatment response
Abstract
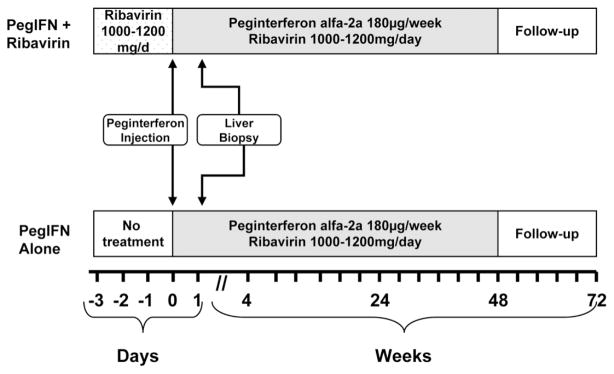
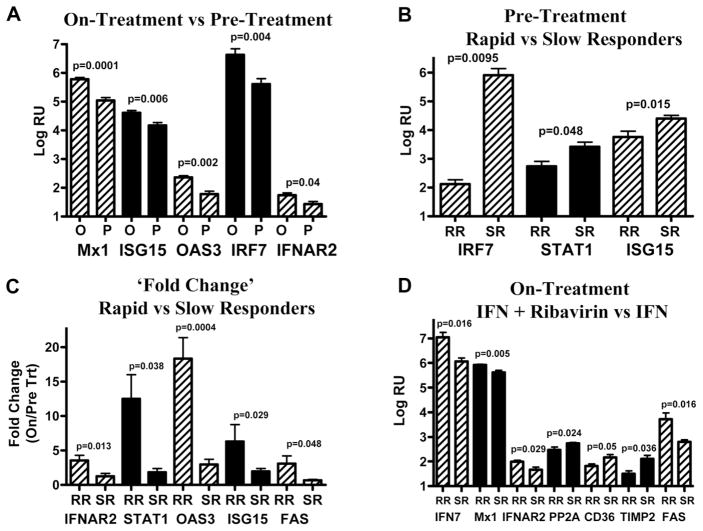
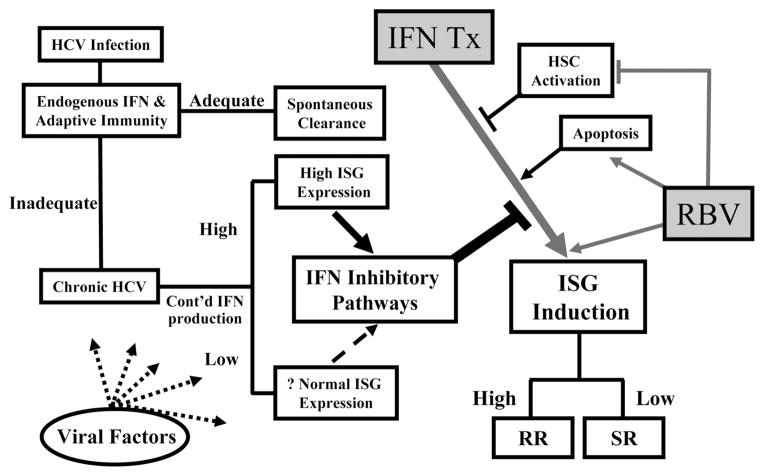
The reasons for hepatitis C treatment failure remain unknown but may be related to different host responses to therapy. In this study, we compared hepatic gene expression in patients prior to and during peginterferon and ribavirin therapy. In the on-treatment group, patients received either ribavirin for 72 hours prior to peginterferon alpha-2a injection or peginterferon alpha-2a for 24 hours, prior to biopsy. The patients were grouped into rapid responders (RRs) with a greater than 2-log drop and slow responders (SRs) with a less than 2-log drop in hepatitis C virus RNA by week 4. Pretreatment biopsy specimens were obtained from a matched control group. The pretreatment patients were grouped as RRs or SRs on the basis of the subsequent treatment response. Gene expression profiling was performed with Affymetrix microarray technology. Known interferon-stimulated genes (ISGs) were induced in treated patients. In the pretreatment group, future SRs had higher pretreatment ISG expression than RRs. On treatment, RRs and SRs had similar absolute ISG expression, but when it was corrected for the baseline expression with the pretreatment group, RRs showed a greater fold change in ISGs, whereas SRs showed a greater change in interferon (IFN)-inhibitory pathways. The patients pretreated with ribavirin had heightened induction of IFN-related genes and down-regulation of genes involved in IFN inhibition and hepatic stellate cell activation.
Conclusion: These data suggest that ISG inducibility is important for the treatment response and that ribavirin may improve outcomes by enhancing hepatic gene responses to peginterferon. Collectively, these mechanisms may provide a molecular basis for the improved efficacy of combination therapy.
Conflict of interest statement
Potential conflict of interest: Dr. Fried is a consultant for and received grants from Roche. Dr. Zacks is on the speakers’ bureau of Roche.
Figures

Comment in
-
Intrahepatic interferon-stimulated gene responses: can they predict treatment responses in chronic hepatitis C infection?Hepatology. 2007 Nov;46(5):1326-8. doi: 10.1002/hep.22006. Hepatology. 2007. PMID: 17969041 No abstract available.
Similar articles
-
Effect of ribavirin on viral kinetics and liver gene expression in chronic hepatitis C.Gut. 2014 Jan;63(1):161-9. doi: 10.1136/gutjnl-2012-303852. Epub 2013 Feb 8. Gut. 2014. PMID: 23396509 Free PMC article. Clinical Trial.
-
Hepatic ISG expression is associated with genetic variation in interleukin 28B and the outcome of IFN therapy for chronic hepatitis C.Gastroenterology. 2010 Aug;139(2):499-509. doi: 10.1053/j.gastro.2010.04.049. Epub 2010 Apr 29. Gastroenterology. 2010. PMID: 20434452
-
Interferon-induced gene expression is a stronger predictor of treatment response than IL28B genotype in patients with hepatitis C.Gastroenterology. 2011 Mar;140(3):1021-31. doi: 10.1053/j.gastro.2010.11.039. Epub 2010 Nov 25. Gastroenterology. 2011. PMID: 21111740
-
Pharmacokinetics and pharmacodynamics of peginterferon and ribavirin: implications for clinical efficacy in the treatment of chronic hepatitis C.Gastroenterol Clin North Am. 2010 Sep;39(3):649-58. doi: 10.1016/j.gtc.2010.08.008. Gastroenterol Clin North Am. 2010. PMID: 20951922 Free PMC article. Review.
-
Peginterferon-alpha-2a (40 kD) plus ribavirin: a review of its use in the management of chronic hepatitis C mono-infection.Drugs. 2008;68(9):1273-317. doi: 10.2165/00003495-200868090-00006. Drugs. 2008. PMID: 18547135 Review.
Cited by
-
Activation of Type I and Type III Interferons in Chronic Hepatitis C.J Innate Immun. 2015;7(3):251-259. doi: 10.1159/000369973. Epub 2015 Jan 28. J Innate Immun. 2015. PMID: 25766746 Free PMC article. Review.
-
Immune responses and immunopathology in acute and chronic viral hepatitis.Nat Rev Immunol. 2016 Aug;16(8):509-23. doi: 10.1038/nri.2016.69. Epub 2016 Jul 4. Nat Rev Immunol. 2016. PMID: 27374637 Review.
-
IL28B in hepatitis C virus infection: translating pharmacogenomics into clinical practice.J Gastroenterol. 2010 Sep;45(9):903-10. doi: 10.1007/s00535-010-0287-4. Epub 2010 Jul 16. J Gastroenterol. 2010. PMID: 20635099 Review.
-
IL28B genetic variations are associated with high sustained virological response (SVR) of interferon-α plus ribavirin therapy in Taiwanese chronic HCV infection.Genes Immun. 2011 Jun;12(4):300-9. doi: 10.1038/gene.2011.1. Epub 2011 Feb 24. Genes Immun. 2011. PMID: 21346780 Free PMC article.
-
Effects of losartan on hepatic expression of nonphagocytic NADPH oxidase and fibrogenic genes in patients with chronic hepatitis C.Am J Physiol Gastrointest Liver Physiol. 2009 Oct;297(4):G726-34. doi: 10.1152/ajpgi.00162.2009. Epub 2009 Jul 23. Am J Physiol Gastrointest Liver Physiol. 2009. PMID: 19628656 Free PMC article. Clinical Trial.
References
-
- Manns MP, McHutchison JG, Gordon SC, Rustgi VK, Shiffman M, Reindollar R, et al. Peginterferon alfa-2b plus ribavirin compared with interferon alfa-2b plus ribavirin for initial treatment of chronic hepatitis C: a randomised trial. Lancet. 2001;358:958–965. - PubMed
-
- Fried MW, Shiffman ML, Reddy KR, Smith C, Marinos G, Goncales FL, Jr, et al. Peginterferon alfa-2a plus ribavirin for chronic hepatitis C virus infection. N Engl J Med. 2002;347:975–982. - PubMed
-
- Hofmann WP, Zeuzem S, Sarrazin C. Hepatitis C virus-related resistance mechanisms to interferon alpha-based antiviral therapy. J Clin Virol. 2005;32:86–91. - PubMed
-
- Conjeevaram HS, Fried MW, Jeffers LJ, Terrault NA, Wiley-Lucas TE, Afdhal N, et al. Peginterferon and ribavirin treatment in African American and Caucasian American patients with hepatitis C genotype 1. Gastroenterology. 2006;131:470–477. - PubMed
-
- Ferenci P. Predictors of response to therapy for chronic hepatitis C. Semin Liver Dis. 2004;24(suppl 2):25–31. - PubMed
Publication types
MeSH terms
Substances
Grants and funding
LinkOut - more resources
Full Text Sources
Other Literature Sources
Medical