

Numerical study of wall effects on buoyant gas-bubble rise in a liquid-filled finite cylinder
- PMID: 17930342
- PMCID: PMC2761096
- DOI: 10.1103/PhysRevE.76.036308
Numerical study of wall effects on buoyant gas-bubble rise in a liquid-filled finite cylinder
Abstract
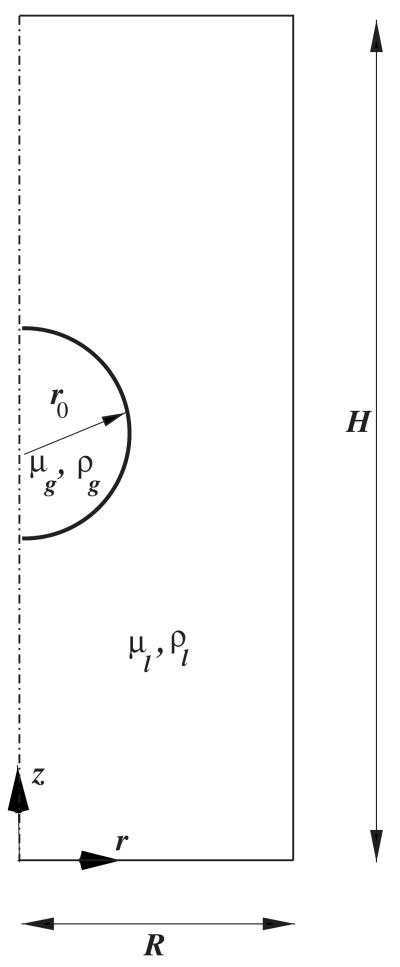
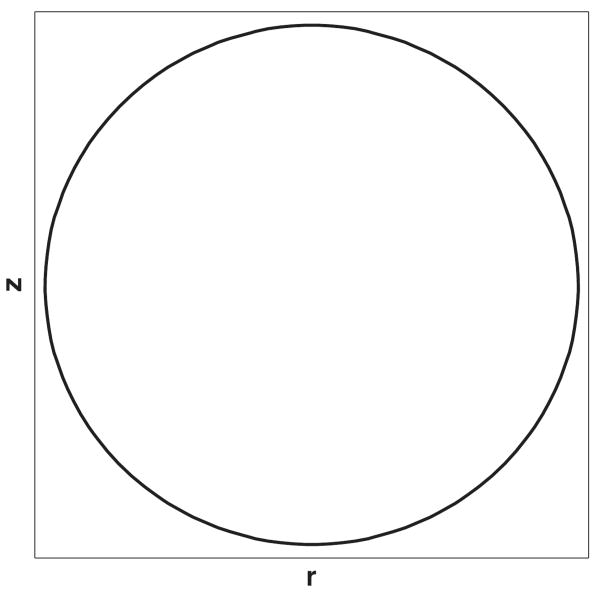
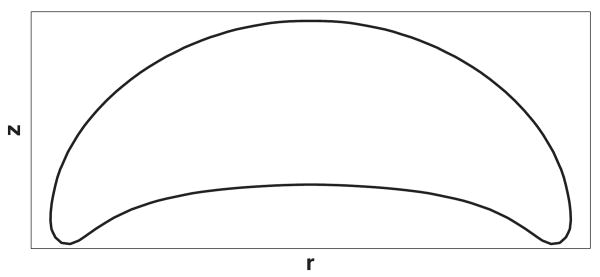
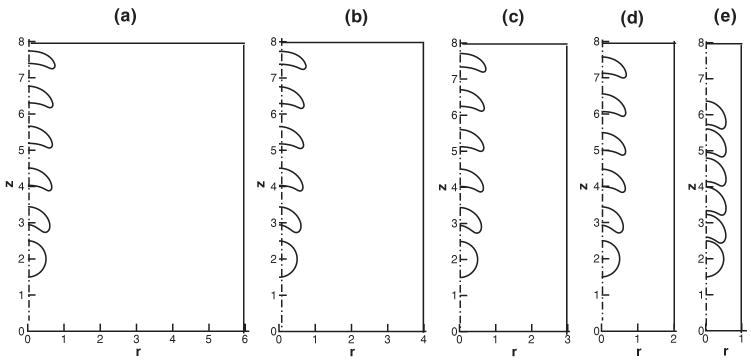
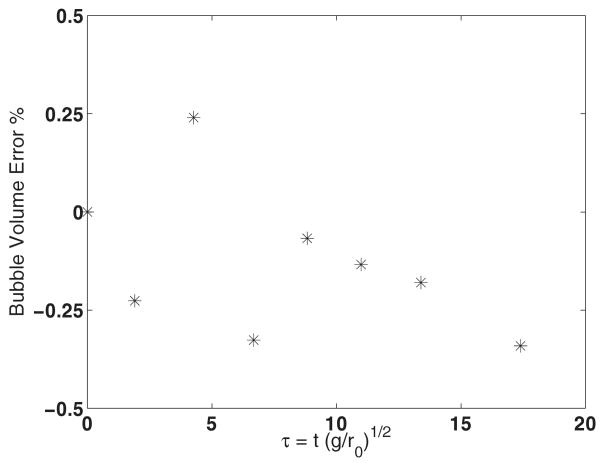
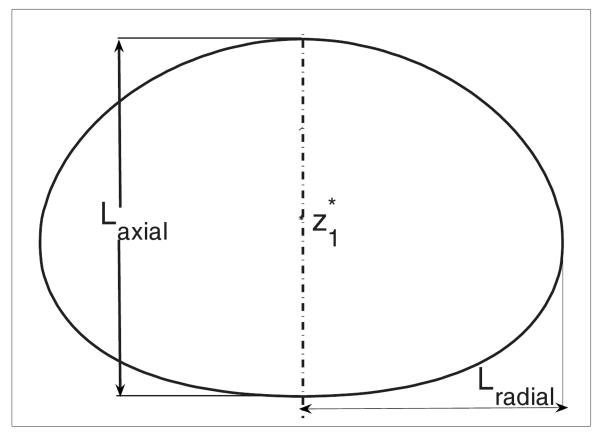
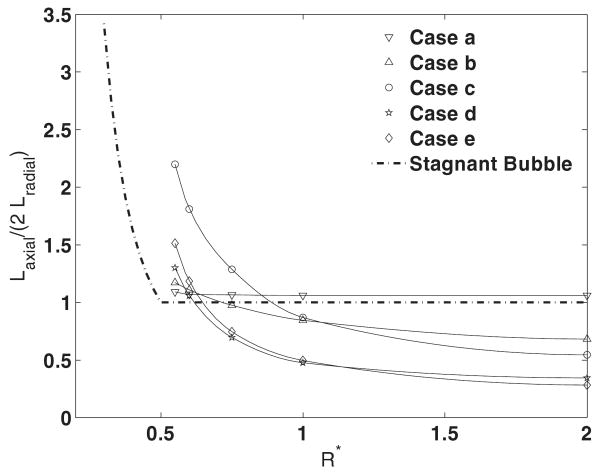
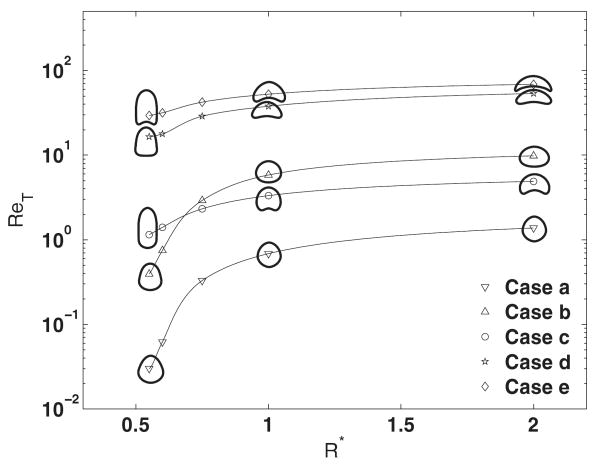
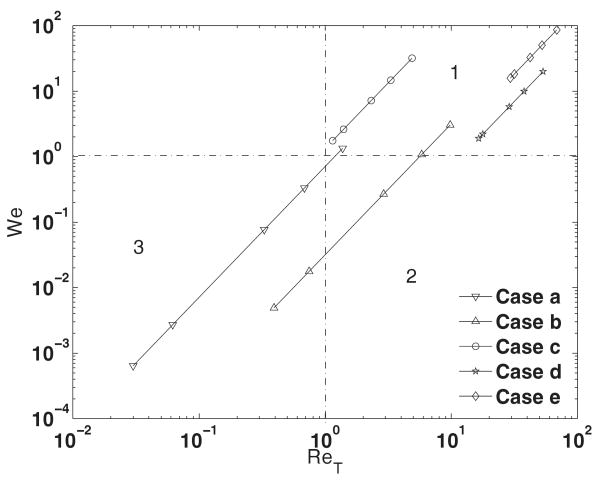
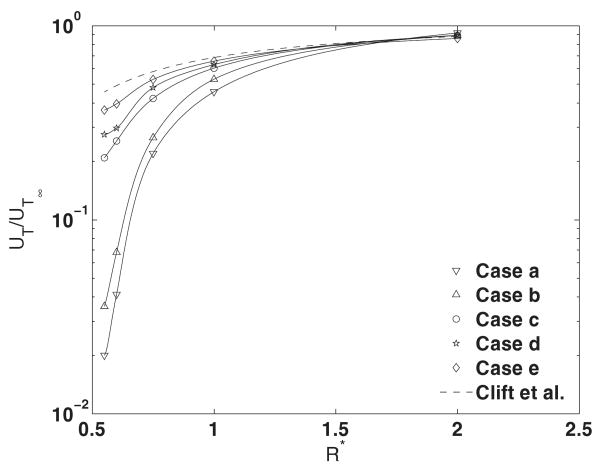
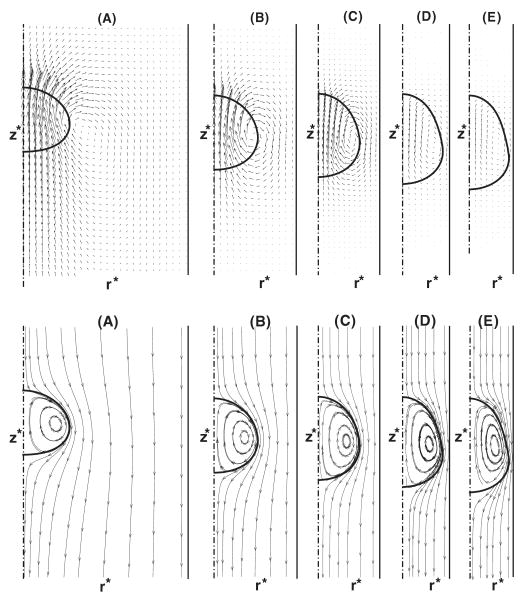
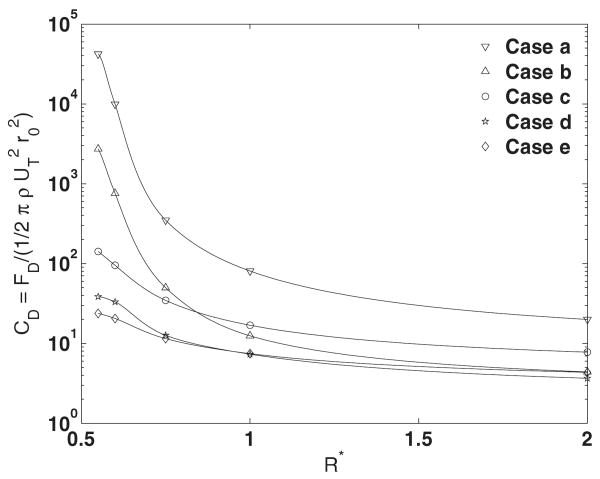
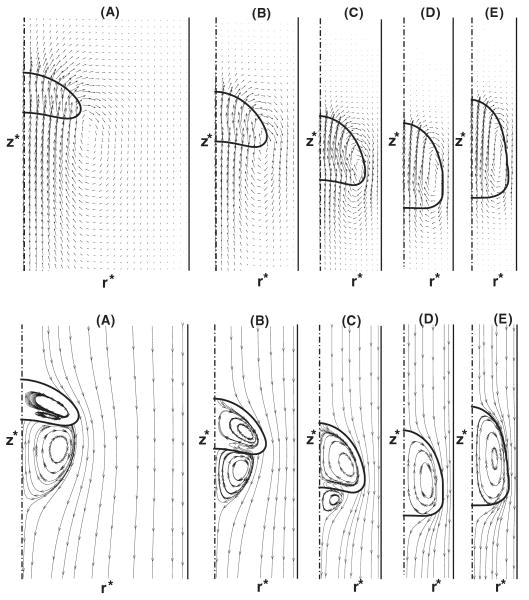
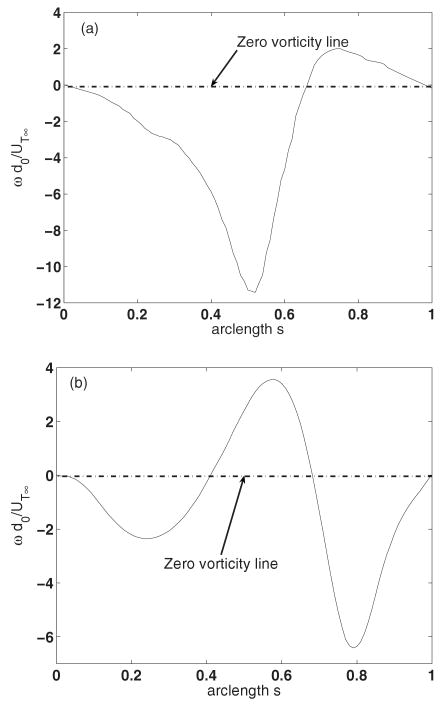
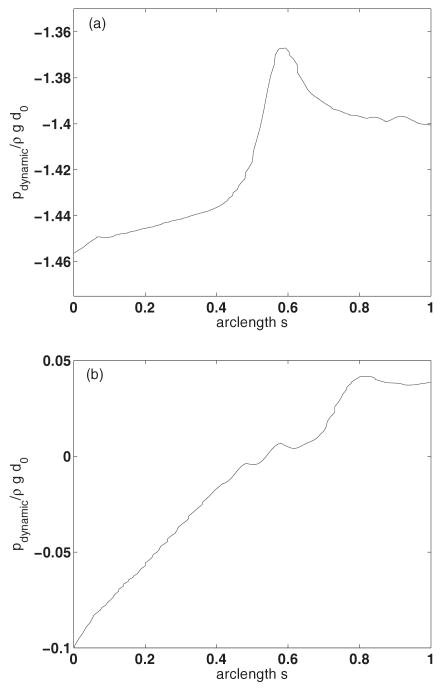
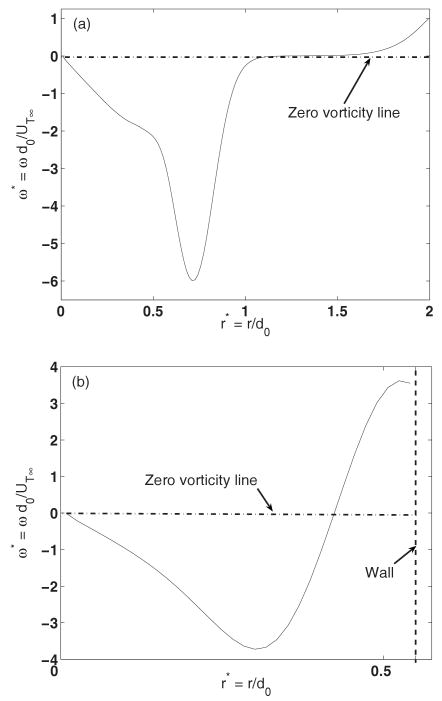
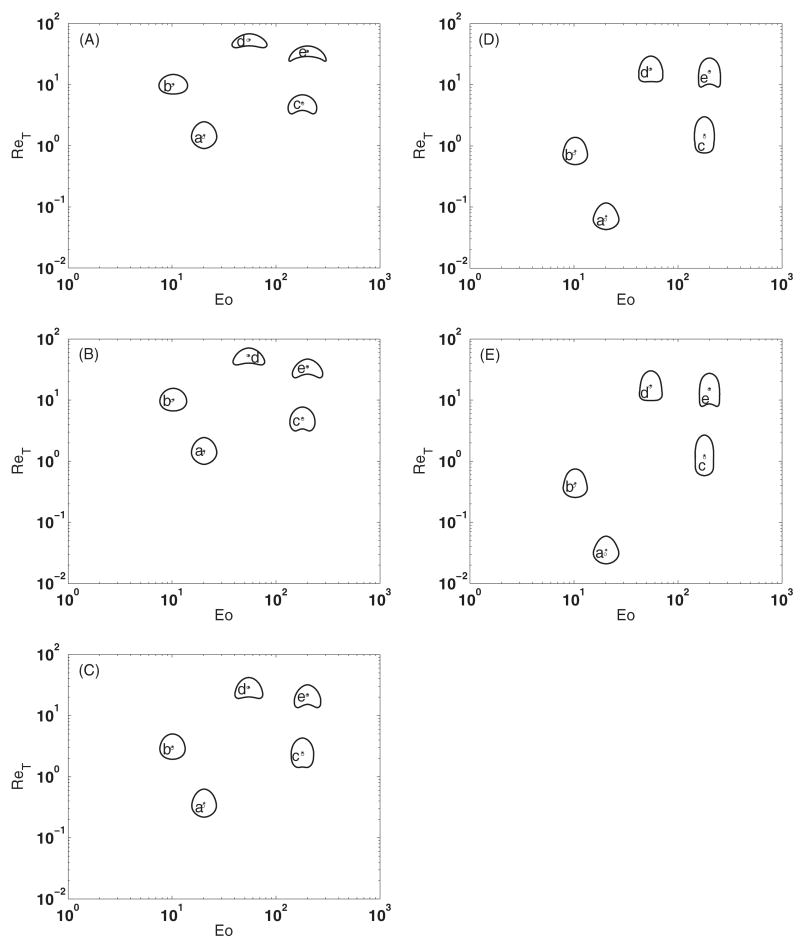
The wall effects on the axisymmetric rise and deformation of an initially spherical gas bubble released from rest in a liquid-filled, finite circular cylinder are numerically investigated. The bulk and gas phases are considered incompressible and immiscible. The bubble motion and deformation are characterized by the Morton number (Mo), Eötvös number (Eo), Reynolds number (Re), Weber number (We), density ratio, viscosity ratio, the ratios of the cylinder height and the cylinder radius to the diameter of the initially spherical bubble ( H*=H/d0, R*=R/d0). Bubble rise in liquids described by Eo and Mo combinations ranging from (1,0.01) to (277.5,0.092), as appropriate to various terminal state Reynolds numbers (ReT) and shapes have been studied. The range of terminal state Reynolds numbers includes 0.02<ReT<70 . Bubble shapes at terminal states vary from spherical to intermediate spherical-cap-skirted. The numerical procedure employs a front tracking finite difference method coupled with a level contour reconstruction of the front. This procedure ensures a smooth distribution of the front points and conserves the bubble volume. For the wide range of Eo and Mo examined, bubble motion in cylinders of height H*=8 and R*> or =3 , is noted to correspond to the rise in an infinite medium, both in terms of Reynolds number and shape at terminal state. In a thin cylindrical vessel (small R*), the motion of the bubble is retarded due to increased total drag and the bubble achieves terminal conditions within a short distance from release. The wake effects on bubble rise are reduced, and elongated bubbles may occur at appropriate conditions. For a fixed volume of the bubble, increasing the cylinder radius may result in the formation of well-defined rear recirculatory wakes that are associated with lateral bulging and skirt formation. The paper includes figures of bubble shape regimes for various values of R*, Eo, Mo, and ReT. Our predictions agree with existing results reported in the literature.
Figures
Similar articles
-
Finite-sized gas bubble motion in a blood vessel: non-Newtonian effects.Phys Rev E Stat Nonlin Soft Matter Phys. 2008 Sep;78(3 Pt 2):036303. doi: 10.1103/PhysRevE.78.036303. Epub 2008 Sep 5. Phys Rev E Stat Nonlin Soft Matter Phys. 2008. PMID: 18851139 Free PMC article.
-
Numerical study of a Taylor bubble rising in stagnant liquids.Phys Rev E Stat Nonlin Soft Matter Phys. 2010 Jun;81(6 Pt 2):066308. doi: 10.1103/PhysRevE.81.066308. Epub 2010 Jun 17. Phys Rev E Stat Nonlin Soft Matter Phys. 2010. PMID: 20866523
-
Bubble motion through a generalized power-law fluid flowing in a vertical tube.Ann N Y Acad Sci. 2009 Apr;1161:256-67. doi: 10.1111/j.1749-6632.2009.04089.x. Ann N Y Acad Sci. 2009. PMID: 19426324 Free PMC article.
-
Intraalveolar bubbles and bubble films: II. Formation in vivo through adulthood.Anat Rec. 1996 Oct;246(2):245-70. doi: 10.1002/(SICI)1097-0185(199610)246:2<245::AID-AR12>3.0.CO;2-O. Anat Rec. 1996. PMID: 8888967 Review.
-
Review of scattering and extinction cross-sections, damping factors, and resonance frequencies of a spherical gas bubble.J Acoust Soc Am. 2011 Nov;130(5):3184-208. doi: 10.1121/1.3628321. J Acoust Soc Am. 2011. PMID: 22087992 Review.
Cited by
-
Nanocarrier Hydrodynamics and Binding in Targeted Drug Delivery: Challenges in Numerical Modeling and Experimental Validation.J Nanotechnol Eng Med. 2013 Feb;4(1):101011-1010115. doi: 10.1115/1.4024004. Epub 2013 Jul 11. J Nanotechnol Eng Med. 2013. PMID: 23917383 Free PMC article. Review.
-
Nanoparticle Brownian motion and hydrodynamic interactions in the presence of flow fields.Phys Fluids (1994). 2011 Jul;23(7):73602-7360215. doi: 10.1063/1.3611026. Epub 2011 Jul 26. Phys Fluids (1994). 2011. PMID: 21918592 Free PMC article.
-
Surfactant properties differentially influence intravascular gas embolism mechanics.Ann Biomed Eng. 2010 Dec;38(12):3649-63. doi: 10.1007/s10439-010-0120-5. Epub 2010 Jul 13. Ann Biomed Eng. 2010. PMID: 20625830 Free PMC article.
-
Finite-sized gas bubble motion in a blood vessel: non-Newtonian effects.Phys Rev E Stat Nonlin Soft Matter Phys. 2008 Sep;78(3 Pt 2):036303. doi: 10.1103/PhysRevE.78.036303. Epub 2008 Sep 5. Phys Rev E Stat Nonlin Soft Matter Phys. 2008. PMID: 18851139 Free PMC article.
-
In vitro surfactant mitigation of gas bubble contact-induced endothelial cell death.Undersea Hyperb Med. 2011 Jan-Feb;38(1):27-39. Undersea Hyperb Med. 2011. PMID: 21384761 Free PMC article.
References
-
- Clift R, Grace JR, Weber ME. Bubbles, Drops, and Particles. Academic; New York: 1978.
-
- Bhaga D, Weber ME. J Fluid Mech. 1981;105:61.
-
- Grace JR, Wairegi T. Encyclopedia of Fluid Mechanics. Vol. 3. Gulf, Houston: 1986. pp. 43–57.
-
- Dandy DS, Leal LG. J Fluid Mech. 1989;208:161.
-
- Sadhal SS, Ayyaswamy PS, Chung JN. Transport Phenomena with Drops and Bubbles. Springer-Verlag; New York: 1997.
Publication types
MeSH terms
Substances
Grants and funding
LinkOut - more resources
Full Text Sources
Miscellaneous